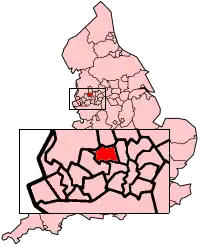
The Metropolitan Borough of Bolton shown within England.
Elections to Bolton Metropolitan Borough Council were held on 2 May 2002. One third of the council was up for election and the Labour party kept overall control of the council.[1]
21 seats were contested in the election with 2 seats being contested in the Burnden ward. 12 were won by the Labour Party, with 5 won by the Conservatives and 4 won by the Liberal Democrats
After the election, the composition of the council was
- Labour 31
- Conservative 16
- Liberal Democrat 13
Result
| Party | Seats | Gains | Losses | Net gain/loss | Seats % | Votes % | Votes | +/− | |
|---|---|---|---|---|---|---|---|---|---|
| Labour | 12 | 0 | 3 | -3 | 57.1 | 40.3 | 27,034 | +4.2% | |
| Conservative | 5 | 1 | 0 | +1 | 23.8 | 33.7 | 22,580 | -5.6% | |
| Liberal Democrats | 4 | 2 | 0 | +2 | 19.0 | 23.2 | 15,526 | +0.4% | |
| Socialist Labour | 0 | 0 | 0 | 0 | 0 | 1.2 | 828 | +0.2% | |
| Independent | 0 | 0 | 0 | 0 | 0 | 0.7 | 459 | +0.0% | |
| Socialist Alliance | 0 | 0 | 0 | 0 | 0 | 0.6 | 425 | +0.6% | |
| Green | 0 | 0 | 0 | 0 | 0 | 0.3 | 197 | +0.2% | |
Council Composition
Prior to the election the composition of the council was:
| 34 | 15 | 11 |
| Labour | Conservative | Lib Dems |
After the election the composition of the council was:
| 31 | 16 | 13 |
| Labour | Conservative | Lib Dems |
Ward results
Astley Bridge ward
| Party | Candidate | Votes | % | ±% | |
|---|---|---|---|---|---|
| Conservative | J Walsh | 2,103 | 53.7 | -10.4 | |
| Labour | S Murray | 1,358 | 34.7 | +7.4 | |
| Liberal Democrats | C McPhearson | 452 | 11.6 | +3.0 | |
| Majority | 745 | 19.0 | -17.8 | ||
| Turnout | 3,913 | 35.0 | +6.0 | ||
| Conservative hold | Swing | Con to Labour 8.9 | |||
Blackrod ward
| Party | Candidate | Votes | % | ±% | |
|---|---|---|---|---|---|
| Labour | I Seddon | 1,255 | 38.1 | +3.8 | |
| Conservative | M Hollick | 1,193 | 36.3 | -2.9 | |
| Liberal Democrats | I Hamilton | 842 | 25.6 | -0.9 | |
| Majority | 62 | 1.8 | |||
| Turnout | 3,290 | 31.0 | +5.0 | ||
| Labour hold | Swing | Con to Labour 3.3 | |||
Bradshaw ward
| Party | Candidate | Votes | % | ±% | |
|---|---|---|---|---|---|
| Conservative | P Brierley | 2,117 | 55.5 | -2.4 | |
| Labour | S Ward | 1,110 | 29.1 | -0.4 | |
| Liberal Democrats | S Howarth | 587 | 15.4 | +2.8 | |
| Majority | 1,007 | 26.4 | -2.0 | ||
| Turnout | 3,814 | 35.0 | +5.0 | ||
| Conservative hold | Swing | Con to LD 2.6 | |||
Breightmet ward
| Party | Candidate | Votes | % | ±% | |
|---|---|---|---|---|---|
| Labour | M Murray | 1,329 | 46.5 | -2.8 | |
| Conservative | R Elliott | 1,173 | 41.1 | +0.2 | |
| Liberal Democrats | S Rock | 353 | 12.4 | +2.6 | |
| Majority | 156 | 5.4 | -3.0 | ||
| Turnout | 2,855 | 28.0 | +7.0 | ||
| Labour hold | Swing | Labour to LD 2.5 | |||
Bromley Cross ward
| Party | Candidate | Votes | % | ±% | |
|---|---|---|---|---|---|
| Conservative | D Carr | 2,393 | 59.7 | +2.2 | |
| Labour | A Muscat | 1,050 | 26.2 | -0.4 | |
| Liberal Democrats | S Ball | 563 | 14.1 | -1.8 | |
| Majority | 1,343 | 33.5 | +2.6 | ||
| Turnout | 4,006 | 36.0 | -9.0 | ||
| Conservative hold | Swing | LD to Con 2.0 | |||
Burnden ward
| Party | Candidate | Votes | % | ±% | |
|---|---|---|---|---|---|
| Labour | P Howarth | 1,280 | 22.3 | ||
| Labour | P Spencer | 1,159 | 20.2 | ||
| Conservative | M Idrees | 1,154 | 20.1 | ||
| Conservative | M Iqbal | 1,105 | 19.3 | ||
| Liberal Democrats | D Connor | 443 | 7.7 | ||
| Liberal Democrats | R Harasiwka | 340 | 5.9 | ||
| Socialist Labour | D Entwistle | 133 | 2.3 | ||
| Socialist Alliance | D Sumner | 115 | 2.0 | ||
| Turnout | 5,729 | 38.0 | +9.0 | ||
| Labour hold | Swing | ||||
| Labour hold | Swing | ||||
Central ward
| Party | Candidate | Votes | % | ±% | |
|---|---|---|---|---|---|
| Labour | H Alli | 1,270 | 44.2 | -3.7 | |
| Conservative | H Simjee | 615 | 21.4 | -21.6 | |
| Independent | V Patel | 459 | 16.0 | +16.0 | |
| Liberal Democrats | M Eidlow | 278 | 9.7 | +3.1 | |
| Socialist Alliance | M Lowe | 144 | 5.0 | +5.0 | |
| Socialist Labour | M McLoughlin | 108 | 3.8 | +1.3 | |
| Majority | 655 | 22.8 | +17.9 | ||
| Turnout | 2,874 | 34.0 | +10.0 | ||
| Labour hold | Swing | Con to Ind 18.8 | |||
Daubhill ward
| Party | Candidate | Votes | % | ±% | |
|---|---|---|---|---|---|
| Labour | G Harkin | 1,404 | 55.7 | +3.2 | |
| Conservative | J Groak | 690 | 27.4 | -6.7 | |
| Liberal Democrats | L Greensit | 428 | 17.0 | +3.6 | |
| Majority | 714 | 28.3 | +9.9 | ||
| Turnout | 2,522 | 28.0 | +7.0 | ||
| Labour hold | Swing | Con to LD 5.1 | |||
Deane-cum-Heaton ward
| Party | Candidate | Votes | % | ±% | |
|---|---|---|---|---|---|
| Conservative | C Shaw | 2,607 | 55.4 | -4.8 | |
| Labour | J Gillatt | 1,199 | 25.5 | +0.1 | |
| Liberal Democrats | S Bromley | 902 | 19.2 | +4.8 | |
| Majority | 1,408 | 29.9 | -4.9 | ||
| Turnout | 4,708 | 34.0 | +5.0 | ||
| Conservative hold | Swing | Con to LD 4.8 | |||
Derby ward
| Party | Candidate | Votes | % | ±% | |
|---|---|---|---|---|---|
| Labour | E Adia | 2,553 | 76.7 | +31.7 | |
| Conservative | G Peel | 384 | 11.5 | -36.2 | |
| Liberal Democrats | S McGeehan | 228 | 6.9 | +3.0 | |
| Socialist Labour | A Entwistle | 162 | 4.9 | +1.6 | |
| Majority | 2,169 | 65.2 | |||
| Turnout | 3,327 | 34.0 | +6.0 | ||
| Labour hold | Swing | Con to Labour 33.9 | |||
Farnworth ward
| Party | Candidate | Votes | % | ±% | |
|---|---|---|---|---|---|
| Labour | J Lord | 1,141 | 59.0 | +3.1 | |
| Conservative | R O'Neill | 344 | 17.8 | -4.5 | |
| Liberal Democrats | A Higson | 317 | 16.4 | +1.0 | |
| Socialist Labour | W Kelly | 133 | 6.9 | +0.5 | |
| Majority | 797 | 41.2 | +7.6 | ||
| Turnout | 1,935 | 20.0 | -5.0 | ||
| Labour hold | Swing | Con to Labour 3.8 | |||
Halliwell ward
| Party | Candidate | Votes | % | ±% | |
|---|---|---|---|---|---|
| Labour | A Zaman | 1,676 | 52.8 | +4.7 | |
| Conservative | J Coombs | 724 | 22.8 | -10.8 | |
| Liberal Democrats | M Cox | 511 | 16.1 | +5.3 | |
| Socialist Labour | H Broadbent | 169 | 5.3 | +0.6 | |
| Green | A Cartmel | 96 | 3.0 | +0.1 | |
| Majority | 952 | 30.0 | +15.5 | ||
| Turnout | 3,176 | 32.0 | +9.0 | ||
| Labour hold | Swing | Con to LD 8.0 | |||
Harper Green ward
| Party | Candidate | Votes | % | ±% | |
|---|---|---|---|---|---|
| Labour | L Williamson | 1,295 | 57.3 | +3.8 | |
| Conservative | R Tyler | 506 | 22.4 | -8.0 | |
| Liberal Democrats | W Cooper | 338 | 14.9 | +3.5 | |
| Socialist Labour | W Kelly | 123 | 5.4 | +0.8 | |
| Majority | 789 | 34.9 | +11.8 | ||
| Turnout | 2,262 | 21.0 | +5.5 | ||
| Labour hold | Swing | Con to Lab 5.9 | |||
Horwich ward
| Party | Candidate | Votes | % | ±% | |
|---|---|---|---|---|---|
| Liberal Democrats | R Ronson | 2,283 | 55.2 | -1.8 | |
| Labour | M Kilcoyne | 1,082 | 26.2 | +4.3 | |
| Conservative | O Fairhurst | 687 | 16.6 | -4.5 | |
| Socialist Alliance | R Ince | 85 | 2.1 | +2.1 | |
| Majority | 1,101 | 29.0 | -6.1 | ||
| Turnout | 4,137 | 36.0 | +7.0 | ||
| Liberal Democrats hold | Swing | Con to Labour 4.4 | |||
Hulton Park ward
| Party | Candidate | Votes | % | ±% | |
|---|---|---|---|---|---|
| Conservative | A Morgan | 1,540 | 36.4 | -5.8 | |
| Liberal Democrats | J Cronnolley | 1,451 | 34.3 | +5.4 | |
| Labour | E Hyland | 1,236 | 29.2 | +0.4 | |
| Majority | 89 | 2.1 | -11.2 | ||
| Turnout | 4,227 | 28.0 | +7.0 | ||
| Conservative gain from Labour | Swing | Con to LD 5.6 | |||
Kearsley ward
| Party | Candidate | Votes | % | ±% | |
|---|---|---|---|---|---|
| Liberal Democrats | W Collison | 1,357 | 48.4 | -5.3 | |
| Labour | D Burrows | 1,182 | 42.2 | +5.7 | |
| Conservative | S Kesler | 263 | 9.4 | -0.4 | |
| Majority | 175 | 6.2 | -11.0 | ||
| Turnout | 2,802 | 27.0 | +4.0 | ||
| Liberal Democrats gain from Labour | Swing | LD to Labour 5.5 | |||
Little Lever ward
| Party | Candidate | Votes | % | ±% | |
|---|---|---|---|---|---|
| Labour | A Connell | 1,550 | 49.4 | +4.5 | |
| Conservative | J Tyler | 1,153 | 36.8 | -7.1 | |
| Liberal Democrats | B Crook | 351 | 11.2 | +0.0 | |
| Socialist Alliance | D Kemp | 81 | 2.6 | +2.6 | |
| Majority | 397 | 12.6 | +11.6 | ||
| Turnout | 3,135 | 34.0 | +8.0 | ||
| Labour hold | Swing | Con to Labour 5.8 | |||
Smithills ward
| Party | Candidate | Votes | % | ±% | |
|---|---|---|---|---|---|
| Liberal Democrats | R Hayes | 1,836 | 59.0 | -5.4 | |
| Conservative | D Bagnall | 605 | 19.4 | -1.0 | |
| Labour | S Hynes | 572 | 18.4 | +3.2 | |
| Green | F Calvert | 101 | 3.2 | +3.2 | |
| Majority | 1,231 | 39.6 | -4.4 | ||
| Turnout | 3,114 | 36.0 | -6.5 | ||
| Liberal Democrats hold | Swing | LD to Labour 4.3 | |||
Tonge ward
| Party | Candidate | Votes | % | ±% | |
|---|---|---|---|---|---|
| Labour | F White | 1,345 | 52.4 | +3.7 | |
| Conservative | N Ford | 879 | 34.3 | +7.7 | |
| Liberal Democrats | M Langdon | 342 | 13.3 | +6.1 | |
| Majority | 466 | 18.1 | -4.0 | ||
| Turnout | 2,566 | 32.0 | +5.5 | ||
| Labour hold | Swing | ||||
Westhoughton ward
| Party | Candidate | Votes | % | ±% | |
|---|---|---|---|---|---|
| Liberal Democrats | J Silvester | 1,324 | 49.8 | -2.0 | |
| Labour | D Chadwick | 988 | 37.2 | +3.3 | |
| Conservative | J Batley | 345 | 13.0 | -1.2 | |
| Majority | 336 | 12.6 | -5.3 | ||
| Turnout | 2,657 | 28.0 | +6.0 | ||
| Liberal Democrats gain from Labour | Swing | LD to Labour 2.6 | |||
Sources
Notes
References
- Rallings, Colin; Thrasher, Michael. "Bolton Metropolitan Borough Council Election Results 1973–2012" (PDF). The Elections Centre. The Elections Centre, Plymouth University. Retrieved 12 July 2016.
This article is issued from Wikipedia. The text is licensed under Creative Commons - Attribution - Sharealike. Additional terms may apply for the media files.