| Colorado's 1st congressional district | |||
|---|---|---|---|
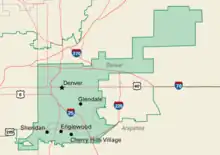
Interactive map of district boundaries since January 3, 2023 | |||
| Representative |
| ||
| Distribution |
| ||
| Population (2022) | 720,042[2] | ||
| Median household income | $87,684[3] | ||
| Ethnicity |
| ||
| Cook PVI | D+29[4] | ||
.svg.png.webp)
Colorado's 1st congressional district is a congressional district in the U.S. state of Colorado based primarily in the City and County of Denver in the central part of the state. The district includes all of the City and County of Denver, and the Denver enclaves of Glendale and Holly Hills.
The district has been represented by Democrat Diana DeGette since 1997. An urban and diverse district based in the heart of Metropolitan Denver and with a Cook Partisan Voting Index rating of D+29, it is the most Democratic district in both Colorado and the Mountain West.[4] Only two Republicans have been elected to the seat since the Great Depression: Dean M. Gillespie was the district's representative from 1944 to 1947; and Mike McKevitt from 1971 to 1973, winning thanks to an ideological split among Denver Democrats. No Republican has even notched 30% of the vote in the district after 1998.
History
1990s
Following the 1990 United States census and consequential redrawing of Colorado's congressional districts, the 1st congressional district consisted of all of the City and County of Denver and parts of Adams, Arapahoe, and Jefferson counties.
2000s
Following the 2000 United States census and consequential redistricting of Colorado's congressional districts, the 1st congressional district consisted of all of the City and County of Denver and parts of Arapahoe County, including parts or all of the cities of Englewood, Cherry Hills Village, Sheridan, Aurora, and Glendale.
2010s
Following the 2010 United States census and consequential redistricting of Colorado's congressional districts, the 1st congressional district consisted of all of the City and County of Denver and parts of Arapahoe County including parts or all of the cities of Englewood, Cherry Hills Village, Sheridan, Aurora, and Glendale. The 1st district also took in additional area in the southwestern suburbs which included parts of Jefferson County and the CDPs of Columbine and Ken Caryl.
2020s
Following the 2020 United States census and consequential redistricting of Colorado's congressional districts, the 1st congressional district consisted of all of the City and County of Denver and parts of Arapahoe County that are enclaves within the Denver city borders such as Glendale and Holly Hills: the Jefferson County portions were moved to the 7th District, while the southern Arapahoe County suburbs were moved to the Aurora-based 6th District.
Voting
| Election Results[5] | ||
|---|---|---|
| Year | Office | Results |
| 2000 | President | Gore 61–33% |
| 2004 | President | Kerry 68–31% |
| 2008 | President | Obama 74–24% |
| 2012 | President | Obama 69–29% |
| 2016 | President | Clinton 69–23% |
| Senate | Bennet 68.8-25.9% | |
| 2018 | Governor | Polis 73.0-23.7% |
| 2020 | President | Biden 76–22% |
| Senate | Hickenlooper 73.7-24.4% | |
List of members representing the district
.jpg.webp)
.jpg.webp)
.jpg.webp)
.jpg.webp)
.jpg.webp)
.jpg.webp)
.tif.png.webp)
_(new_version).svg.png.webp)
Election results
1892
| Party | Candidate | Votes | % | |||
|---|---|---|---|---|---|---|
| Populist | Lafayette Pence | 20,004 | 49.11% | |||
| Republican | Earl B. Coe | 17,609 | 43.23% | |||
| Democratic | John G. Taylor | 2,240 | 5.50% | |||
| Prohibition | W.G. Sprague | 876 | 2.15% | |||
| Majority | 2,395 | 5.88% | ||||
| Total votes | 40,729 | 100% | ||||
| Populist gain from new seat | ||||||
1894
| Party | Candidate | Votes | % | |||
|---|---|---|---|---|---|---|
| Republican | John F. Shafroth | 47,710 | 55.32% | |||
| Populist | Lafayette Pence (incumbent) | 34,223 | 39.68% | |||
| Prohibition | Robert H. Rhodes | 2,465 | 2.86% | |||
| Democratic | John T. Bottom | 1,847 | 2.14% | |||
| Majority | 13,487 | 15.64% | ||||
| Total votes | 86,245 | 100% | ||||
| Republican gain from Populist | ||||||
1896
| Party | Candidate | Votes | % | ||
|---|---|---|---|---|---|
| Silver Republican | John F. Shafroth (incumbent) | 67,821 | 84.89% | ||
| Republican | T.E. McClelland | 9,625 | 12.05% | ||
| Natural Prohibition | J.J. Losh | 1,083 | 1.36% | ||
| Prohibition | W.T. Steele | 1,006 | 1.26% | ||
| National | Dayton O. Gilbert | 181 | 0.23% | ||
| Socialist Labor | William Dye | 173 | 0.22% | ||
| Majority | 58,196 | 72.84% | |||
| Total votes | 79,889 | 100% | |||
| Silver Republican hold | |||||
1898
| Party | Candidate | Votes | % | ||
|---|---|---|---|---|---|
| Silver Republican | John F. Shafroth (incumbent) | 43,111 | 67.61% | ||
| Republican | Charles Hartsell | 18,580 | 29.14% | ||
| Prohibition | Dayton O. Gilbert | 1,410 | 2.21% | ||
| Socialist Labor | Nathan L. Griest | 667 | 1.05% | ||
| Majority | 24,531 | 38.47% | |||
| Total votes | 63,768 | 100% | |||
| Silver Republican hold | |||||
1900
| Party | Candidate | Votes | % | ||
|---|---|---|---|---|---|
| Silver Republican | John F. Shafroth (incumbent) | 54,591 | 55.32% | ||
| Republican | Robert W. Bonynge | 41,518 | 42.07% | ||
| Prohibition | S.H. Shellenger | 1,924 | 1.95% | ||
| Socialist Labor | Joseph Smith | 326 | 0.33% | ||
| Social Democratic | Charles M. Davis | 320 | 0.32% | ||
| Majority | 13,073 | 13.25% | |||
| Total votes | 98,679 | 100% | |||
| Silver Republican hold | |||||
1902
| Party | Candidate | Votes | % | |
|---|---|---|---|---|
| Democratic | John F. Shafroth (incumbent) | 41,440 | 48.98% | |
| Republican | Robert W. Bonynge | 38,648 | 45.68% | |
| Socialist | Marshall DeWitt | 2,680 | 3.17% | |
| Prohibition | Franklin Moore | 1,832 | 2.17% | |
| Majority | 2,792 | 3.30% | ||
| Total votes | 84,600 | 100% | ||
| Democratic hold | ||||
1904
| Party | Candidate | Votes | % | |
|---|---|---|---|---|
| Republican | Robert W. Bonynge (incumbent) | 55,940 | 51.74% | |
| Democratic | Clay B. Whitford | 50,022 | 46.27% | |
| Prohibition | William C. Johnston | 2,153 | 1.99% | |
| Majority | 5,918 | 5.47% | ||
| Total votes | 108,115 | 100% | ||
| Republican hold | ||||
1906
| Party | Candidate | Votes | % | |
|---|---|---|---|---|
| Republican | Robert W. Bonynge (incumbent) | 47,549 | 55.48% | |
| Democratic | Charles F. Tew | 31,133 | 36.32% | |
| Socialist | Luella Twining | 4,989 | 5.82% | |
| Prohibition | E.E. Evans | 2,039 | 2.38% | |
| Majority | 16,416 | 19.16% | ||
| Total votes | 85,710 | 100% | ||
| Republican hold | ||||
1908
| Party | Candidate | Votes | % | |||
|---|---|---|---|---|---|---|
| Democratic | Atterson W. Rucker | 60,643 | 49.87% | |||
| Republican | Robert W. Bonynge (incumbent) | 57,597 | 47.37% | |||
| Socialist | S.S. Greear | 3,356 | 2.76% | |||
| Majority | 3,046 | 2.50% | ||||
| Total votes | 121,596 | 100% | ||||
| Democratic gain from Republican | ||||||
1910
| Party | Candidate | Votes | % | |
|---|---|---|---|---|
| Democratic | Atterson W. Rucker (incumbent) | 40,458 | 40.77% | |
| Republican | James C. Burger | 37,966 | 38.26% | |
| Prohibition | George John Kindel | 17,144 | 17.28% | |
| Socialist | John W. Martin | 3,661 | 3.69% | |
| Majority | 2,492 | 2.51% | ||
| Total votes | 99,229 | 100% | ||
| Democratic hold | ||||
1912
| Party | Candidate | Votes | % | |
|---|---|---|---|---|
| Democratic | George John Kindel | 54,504 | 45.84% | |
| Progressive | W. J. Crank | 30,121 | 25.33% | |
| Republican | Rice W. Means | 24,887 | 20.93% | |
| Socialist | John W. Martin | 6,757 | 5.68% | |
| Prohibition | Otto A. Reinhardt | 2,642 | 2.22% | |
| Majority | 24,383 | 20.51% | ||
| Total votes | 118,911 | 100% | ||
| Democratic hold | ||||
1914
| Party | Candidate | Votes | % | |
|---|---|---|---|---|
| Democratic | Benjamin C. Hilliard | 26,169 | 40.56% | |
| Republican | Horace F. Phelps | 21,569 | 33.43% | |
| Progressive | Archibald A. Lee | 8,729 | 13.53% | |
| Independent | Atterson W. Rucker | 5,445 | 8.44% | |
| Socialist | Benjamin Blumenberg | 2,612 | 4.05% | |
| Majority | 4,600 | 7.13% | ||
| Total votes | 64,524 | 100% | ||
| Democratic hold | ||||
1916
| Party | Candidate | Votes | % | |
|---|---|---|---|---|
| Democratic | Benjamin C. Hilliard (incumbent) | 30,146 | 48.53% | |
| Republican | William N. Vaile | 26,121 | 42.05% | |
| Liberal | George John Kindel | 3,306 | 5.32% | |
| Socialist | Charles A. Ahlstrom | 2,551 | 4.11% | |
| Majority | 4,025 | 6.48% | ||
| Total votes | 62,124 | 100% | ||
| Democratic hold | ||||
1918
| Party | Candidate | Votes | % | |||
|---|---|---|---|---|---|---|
| Republican | William N. Vaile | 27,815 | 54.19% | |||
| Democratic | John L. Stack | 16,364 | 31.88% | |||
| Independent | Benjamin C. Hilliard (incumbent) | 6,112 | 11.91% | |||
| Socialist | Fred Underhill | 1,039 | 2.02% | |||
| Majority | 11,451 | 22.31% | ||||
| Total votes | 51,330 | 100% | ||||
| Republican gain from Democratic | ||||||
1920
| Party | Candidate | Votes | % | |
|---|---|---|---|---|
| Republican | William N. Vaile (incumbent) | 45,658 | 66.93% | |
| Democratic | Benjamin C. Hilliard | 22,557 | 33.07% | |
| Majority | 23,101 | 33.86% | ||
| Total votes | 68,215 | 100% | ||
| Republican hold | ||||
1922
| Party | Candidate | Votes | % | |
|---|---|---|---|---|
| Republican | William N. Vaile (incumbent) | 32,939 | 55.48% | |
| Democratic | Benjamin C. Hilliard | 25,477 | 42.91% | |
| Farmer–Labor | Hattie K. Howard | 959 | 1.62% | |
| Majority | 7,462 | 12.57% | ||
| Total votes | 59,375 | 100% | ||
| Republican hold | ||||
1924
| Party | Candidate | Votes | % | |
|---|---|---|---|---|
| Republican | William N. Vaile (incumbent) | 47,155 | 54.19% | |
| Democratic | James G. Edgeworth | 36,519 | 41.97% | |
| Farmer–Labor | Thomas O. Spacey | 2,686 | 3.09% | |
| Workers | Louis A. Zetlin | 654 | 0.75% | |
| Majority | 10,636 | 12.22% | ||
| Total votes | 87,014 | 100% | ||
| Republican hold | ||||
1926
| Party | Candidate | Votes | % | |
|---|---|---|---|---|
| Republican | William N. Vaile (incumbent) | 39,909 | 54.86% | |
| Democratic | Benjamin C. Hilliard | 30,337 | 41.70% | |
| Farmer–Labor | Isaac Dunn | 1,972 | 2.71% | |
| Socialist | Clyde Robinson | 530 | 0.73% | |
| Majority | 9,572 | 13.16% | ||
| Total votes | 72,748 | 100% | ||
| Republican hold | ||||
1927 (special)
| Party | Candidate | Votes | % | |||
|---|---|---|---|---|---|---|
| Democratic | S. Harrison White | 32,171 | 51.52% | |||
| Republican | Francis J. Knauss | 27,456 | 43.97% | |||
| Independent | George John Kindel | 2,556 | 4.09% | |||
| Farmer–Labor | Huston Hugh Marrs | 261 | 0.42% | |||
| Majority | 4,715 | 7.55% | ||||
| Total votes | 62,444 | 100% | ||||
| Democratic gain from Republican | ||||||
1928
| Party | Candidate | Votes | % | |||
|---|---|---|---|---|---|---|
| Republican | William R. Eaton | 63,258 | 58.08% | |||
| Democratic | S. Harrison White (incumbent) | 44,713 | 41.05% | |||
| Workers | William R. Dietrich | 949 | 0.87% | |||
| Majority | 18,545 | 17.03% | ||||
| Total votes | 108,920 | 100% | ||||
| Republican gain from Democratic | ||||||
1930
| Party | Candidate | Votes | % | |
|---|---|---|---|---|
| Republican | William R. Eaton (incumbent) | 39,907 | 50.33% | |
| Democratic | Lawrence Lewis | 38,152 | 48.12% | |
| Farmer–Labor | W.R. Duke | 813 | 1.03% | |
| Communist | Louis A. Zeitlin | 411 | 0.52% | |
| Majority | 1,755 | 2.21% | ||
| Total votes | 79,283 | 100% | ||
| Republican hold | ||||
1932
| Party | Candidate | Votes | % | |||
|---|---|---|---|---|---|---|
| Democratic | Lawrence Lewis | 70,826 | 54.41% | |||
| Republican | William R. Eaton (incumbent) | 56,601 | 43.49% | |||
| Socialist | Bruce Lamont | 1,926 | 1.48% | |||
| Communist | Charles Guynn | 422 | 0.32% | |||
| Farmer–Labor | W. R. Duke | 385 | 0.30% | |||
| Majority | 14,225 | 10.92% | ||||
| Total votes | 130,160 | 100% | ||||
| Democratic gain from Republican | ||||||
1934
| Party | Candidate | Votes | % | |
|---|---|---|---|---|
| Democratic | Lawrence Lewis (incumbent) | 59,744 | 56.04% | |
| Republican | William R. Eaton | 34,073 | 31.96% | |
| Old Age Pension | Charles W. Varnum | 9,511 | 8.92% | |
| Socialist | Carle Whitehead | 2,540 | 2.38% | |
| Communist | George Bardwell | 743 | 0.70% | |
| Majority | 25,671 | 24.08% | ||
| Total votes | 106,611 | 100% | ||
| Democratic hold | ||||
1936
| Party | Candidate | Votes | % | |
|---|---|---|---|---|
| Democratic | Lawrence Lewis (incumbent) | 100,704 | 68.96% | |
| Republican | Harry Zimmerhackel | 41,574 | 28.47% | |
| Farmer–Labor | Louella Grant Shirley | 2,675 | 1.83% | |
| Socialist | F. S. Kidneigh | 1,073 | 0.73% | |
| Majority | 59,130 | 40.49% | ||
| Total votes | 146,026 | 100% | ||
| Democratic hold | ||||
1938
| Party | Candidate | Votes | % | |
|---|---|---|---|---|
| Democratic | Lawrence Lewis (incumbent) | 83,517 | 65.31% | |
| Republican | William I. Reilly | 42,758 | 33.44% | |
| Socialist | Edgar P. Sherman | 913 | 0.71% | |
| Prohibition | Oliver L. Barnes | 688 | 0.54% | |
| Majority | 40,759 | 31.87% | ||
| Total votes | 127,876 | 100% | ||
| Democratic hold | ||||
1940
| Party | Candidate | Votes | % | |
|---|---|---|---|---|
| Democratic | Lawrence Lewis (incumbent) | 110,078 | 64.72% | |
| Republican | James D. Parriott | 59,427 | 34.94% | |
| Socialist | Ward Rogers | 577 | 0.34% | |
| Majority | 50,651 | 29.78% | ||
| Total votes | 170,082 | 100% | ||
| Democratic hold | ||||
1942
| Party | Candidate | Votes | % | |
|---|---|---|---|---|
| Democratic | Lawrence Lewis (incumbent) | 58,143 | 53.39% | |
| Republican | Olaf H. Jacobson | 50,083 | 45.99% | |
| Socialist | Ward Rogers | 681 | 0.63% | |
| Majority | 8,060 | 7.40% | ||
| Total votes | 108,907 | 100% | ||
| Democratic hold | ||||
1944 (special)
| Party | Candidate | Votes | % | |||
|---|---|---|---|---|---|---|
| Republican | Dean M. Gillespie | 41,319 | 51.55% | |||
| Democratic | Carl E. Wuertele | 38,394 | 47.90% | |||
| Socialist | Edgar P. Sherman | 230 | 0.29% | |||
| Independent | George M. Phillips | 160 | 0.20% | |||
| Liberal | Frank H. Rice | 51 | 0.06% | |||
| Majority | 2,925 | 3.65% | ||||
| Total votes | 80,154 | 100% | ||||
| Republican gain from Democratic | ||||||
1944 (general)
| Party | Candidate | Votes | % | |
|---|---|---|---|---|
| Republican | Dean M. Gillespie (incumbent) | 90,151 | 51.75% | |
| Democratic | Charles A. Graham | 83,253 | 47.79% | |
| Socialist | Edgar P. Sherman | 798 | 0.46% | |
| Majority | 6,898 | 3.96% | ||
| Total votes | 174,202 | 100% | ||
| Republican hold | ||||
1946
| Party | Candidate | Votes | % | |||
|---|---|---|---|---|---|---|
| Democratic | John A. Carroll | 60,513 | 51.75% | |||
| Republican | Dean M. Gillespie (incumbent) | 55,724 | 47.66% | |||
| Socialist | Edgar P. Sherman | 691 | 0.59% | |||
| Majority | 4,789 | 4.09% | ||||
| Total votes | 116,928 | 100% | ||||
| Democratic gain from Republican | ||||||
1948
| Party | Candidate | Votes | % | |
|---|---|---|---|---|
| Democratic | John A. Carroll (incumbent) | 106,096 | 64.84% | |
| Republican | Christopher F. Cusack | 57,541 | 35.16% | |
| Majority | 48,555 | 29.68% | ||
| Total votes | 163,637 | 100% | ||
| Democratic hold | ||||
1950
| Party | Candidate | Votes | % | |
|---|---|---|---|---|
| Democratic | Byron G. Rogers | 70,165 | 50.31% | |
| Republican | Richard G. Luxford | 67,436 | 48.35% | |
| Independent | Tillman H. Eeb | 1,287 | 0.92% | |
| Socialist | Carle Whitehead | 585 | 0.42% | |
| Majority | 2,729 | 1.96% | ||
| Total votes | 139,473 | 100% | ||
| Democratic hold | ||||
1952
| Party | Candidate | Votes | % | |
|---|---|---|---|---|
| Democratic | Byron G. Rogers (incumbent) | 101,864 | 50.78% | |
| Republican | Mason K. Knuckles | 97,442 | 48.57% | |
| Socialist | Carle Whitehead | 1,307 | 0.65% | |
| Majority | 4,422 | 2.21% | ||
| Total votes | 200,613 | 100% | ||
| Democratic hold | ||||
1954
| Party | Candidate | Votes | % | |
|---|---|---|---|---|
| Democratic | Byron G. Rogers (incumbent) | 84,745 | 55.62% | |
| Republican | Ellen G. Harris | 67,210 | 44.11% | |
| Socialist | Carle Whitehead | 415 | 0.27% | |
| Majority | 17,535 | 11.51% | ||
| Total votes | 152,370 | 100% | ||
| Democratic hold | ||||
1956
| Party | Candidate | Votes | % | |
|---|---|---|---|---|
| Democratic | Byron G. Rogers (incumbent) | 116,487 | 57.78% | |
| Republican | Robert S. McCollum | 85,127 | 42.22% | |
| Majority | 31,360 | 15.56% | ||
| Total votes | 201,614 | 100% | ||
| Democratic hold | ||||
1958
| Party | Candidate | Votes | % | |
|---|---|---|---|---|
| Democratic | Byron G. Rogers (incumbent) | 107,567 | 66.66% | |
| Republican | John L. Harpel | 53,801 | 33.34% | |
| Majority | 53,766 | 33.32% | ||
| Total votes | 161,368 | 100% | ||
| Democratic hold | ||||
1960
| Party | Candidate | Votes | % | |
|---|---|---|---|---|
| Democratic | Byron G. Rogers (incumbent) | 121,610 | 60.01% | |
| Republican | Robert D. Rolander | 81,042 | 39.99% | |
| Majority | 40,568 | 20.02% | ||
| Total votes | 202,652 | 100% | ||
| Democratic hold | ||||
1962
| Party | Candidate | Votes | % | |
|---|---|---|---|---|
| Democratic | Byron G. Rogers (incumbent) | 94,680 | 56.00% | |
| Republican | William B. Chenoweth | 74,392 | 44.00% | |
| Majority | 20,288 | 12.00% | ||
| Total votes | 169,072 | 100% | ||
| Democratic hold | ||||
1964
| Party | Candidate | Votes | % | |
|---|---|---|---|---|
| Democratic | Byron G. Rogers (incumbent) | 138,475 | 67.52% | |
| Republican | Glenn R. Jones | 65,423 | 31.90% | |
| Socialist Workers | Allen D. Taplin | 1,183 | 0.58% | |
| Majority | 73,052 | 35.62% | ||
| Total votes | 205,081 | 100% | ||
| Democratic hold | ||||
1966
| Party | Candidate | Votes | % | |
|---|---|---|---|---|
| Democratic | Byron G. Rogers (incumbent) | 92,688 | 56.03% | |
| Republican | Greg Perason | 72,732 | 43.97% | |
| Majority | 19,956 | 12.06% | ||
| Total votes | 165,420 | 100% | ||
| Democratic hold | ||||
1968
| Party | Candidate | Votes | % | |
|---|---|---|---|---|
| Democratic | Byron G. Rogers (incumbent) | 91,199 | 45.74% | |
| Republican | Frank A. Kemp, Jr. | 82,677 | 41.47% | |
| American Independent | Gordon G. Barnwall | 25,499 | 12.79% | |
| Majority | 8,522 | 4.27% | ||
| Total votes | 199,375 | 100% | ||
| Democratic hold | ||||
1970
| Party | Candidate | Votes | % | |||
|---|---|---|---|---|---|---|
| Republican | Mike McKevitt | 84,643 | 51.50% | |||
| Democratic | Craig S. Barnes | 74,444 | 45.30% | |||
| Raza Unida | Salvadore Carpio, Jr. | 5,257 | 3.20% | |||
| Majority | 10,199 | 6.20% | ||||
| Total votes | 164,344 | 100% | ||||
| Republican gain from Democratic | ||||||
1972
| Party | Candidate | Votes | % | |||
|---|---|---|---|---|---|---|
| Democratic | Pat Schroeder | 101,832 | 51.56% | |||
| Republican | Mike McKevitt (incumbent) | 93,733 | 47.46% | |||
| Raza Unida | Maria Pauline Serna | 1,629 | 0.82% | |||
| Socialist Workers | Fern Gapin | 301 | 0.15% | |||
| Majority | 8,099 | 4.10% | ||||
| Total votes | 197,495 | 100% | ||||
| Democratic gain from Republican | ||||||
1974
| Party | Candidate | Votes | % | |
|---|---|---|---|---|
| Democratic | Pat Schroeder (incumbent) | 94,583 | 58.48% | |
| Republican | Frank Southworth | 66,046 | 40.84% | |
| American | Elmer B. Sachs | 1,105 | 0.68% | |
| Majority | 27,637 | 17.64% | ||
| Total votes | 161,734 | 100% | ||
| Democratic hold | ||||
1976
| Party | Candidate | Votes | % | |
|---|---|---|---|---|
| Democratic | Pat Schroeder (incumbent) | 103,037 | 53.22% | |
| Republican | Don Friedman | 89,384 | 46.17% | |
| Socialist Workers | Priscilla Schenk | 681 | 0.35% | |
| U.S. Labor | Lann Meyers | 508 | 0.26% | |
| Majority | 13,653 | 7.05% | ||
| Total votes | 193,610 | 100% | ||
| Democratic hold | ||||
1978
| Party | Candidate | Votes | % | |
|---|---|---|---|---|
| Democratic | Pat Schroeder (incumbent) | 82,742 | 61.46% | |
| Republican | Gene Hutcheson | 49,845 | 37.02% | |
| Socialist Workers | Susan Lorraine Adley | 2,043 | 1.52% | |
| Majority | 32,897 | 24.44% | ||
| Total votes | 134,630 | 100% | ||
| Democratic hold | ||||
1980
| Party | Candidate | Votes | % | |
|---|---|---|---|---|
| Democratic | Pat Schroeder (incumbent) | 107,364 | 59.77% | |
| Republican | Naomi Bradford | 67,804 | 37.75% | |
| Libertarian | John Mason | 3,888 | 2.16% | |
| Socialist Workers | Harold Sudmeyer | 566 | 0.32% | |
| Majority | 52,355 | 25.68% | ||
| Total votes | 179,622 | 100% | ||
| Democratic hold | ||||
1982
| Party | Candidate | Votes | % | |
|---|---|---|---|---|
| Democratic | Pat Schroeder (incumbent) | 94,969 | 60.26% | |
| Republican | Arch Decker | 59,009 | 37.44% | |
| Libertarian | Robin White | 3,619 | 2.30% | |
| Majority | 35,960 | 22.82% | ||
| Total votes | 157,597 | 100% | ||
| Democratic hold | ||||
1984
| Party | Candidate | Votes | % | |
|---|---|---|---|---|
| Democratic | Pat Schroeder (incumbent) | 126,348 | 61.97% | |
| Republican | Mary Downs | 73,993 | 36.29% | |
| Socialist Workers | Cathy Emminizer | 1,846 | 0.91% | |
| Libertarian | Dwight Filley | 1,686 | 0.83% | |
| Majority | 52,355 | 25.68% | ||
| Total votes | 203,873 | 100% | ||
| Democratic hold | ||||
1986
| Party | Candidate | Votes | % | |
|---|---|---|---|---|
| Democratic | Pat Schroeder (incumbent) | 106,113 | 68.37% | |
| Republican | Joy Wood | 49,095 | 31.63% | |
| Majority | 57,018 | 36.74% | ||
| Total votes | 155,208 | 100% | ||
| Democratic hold | ||||
1988
| Party | Candidate | Votes | % | |
|---|---|---|---|---|
| Democratic | Pat Schroeder (incumbent) | 133,922 | 69.93% | |
| Republican | Joy Wood | 57,587 | 30.07% | |
| Majority | 76,335 | 39.86% | ||
| Total votes | 191,509 | 100% | ||
| Democratic hold | ||||
1990
| Party | Candidate | Votes | % | |
|---|---|---|---|---|
| Democratic | Pat Schroeder (incumbent) | 82,176 | 63.71% | |
| Republican | Gloria Gonzales Roemer | 46,802 | 36.29% | |
| Majority | 35,374 | 27.42% | ||
| Total votes | 128,978 | 100% | ||
| Democratic hold | ||||
1992
| Party | Candidate | Votes | % | |
|---|---|---|---|---|
| Democratic | Pat Schroeder (incumbent) | 156,629 | 68.84% | |
| Republican | Raymond Diaz Aragon | 70,902 | 31.16% | |
| Majority | 85,727 | 37.68% | ||
| Total votes | 227,531 | 100% | ||
| Democratic hold | ||||
1994
| Party | Candidate | Votes | % | |
|---|---|---|---|---|
| Democratic | Pat Schroeder (incumbent) | 93,123 | 59.98% | |
| Republican | William F. Eggert | 61,978 | 39.92% | |
| Write-in | Write-ins | 154 | 0.10% | |
| Majority | 31,145 | 20.06% | ||
| Total votes | 155,255 | 100% | ||
| Democratic hold | ||||
1996
| Party | Candidate | Votes | % | |
|---|---|---|---|---|
| Democratic | Diana DeGette | 112,631 | 56.93% | |
| Republican | Joe Rogers | 79,540 | 40.20% | |
| Libertarian | Richard Combs | 5,668 | 2.86% | |
| Majority | 33,091 | 16.73% | ||
| Total votes | 197,839 | 100% | ||
| Democratic hold | ||||
1998
| Party | Candidate | Votes | % | |
|---|---|---|---|---|
| Democratic | Diana DeGette (incumbent) | 116,628 | 66.91% | |
| Republican | Nancy McClanahan | 52,452 | 30.09% | |
| Libertarian | Richard Combs | 5,225 | 3.00% | |
| Majority | 64,176 | 36.82% | ||
| Total votes | 174,305 | 100% | ||
| Democratic hold | ||||
2000
| Party | Candidate | Votes | % | |
|---|---|---|---|---|
| Democratic | Diana DeGette (incumbent) | 141,831 | 68.71% | |
| Republican | Jesse L. Thomas | 56,291 | 27.27% | |
| Libertarian | Richard Combs | 5,852 | 2.83% | |
| Reform | Lyle Nasser | 2,452 | 1.19% | |
| Write-in | Write-ins | 8 | 0.00% | |
| Majority | 85,540 | 41.44% | ||
| Total votes | 206,434 | 100% | ||
| Democratic hold | ||||
2002
| Party | Candidate | Votes | % | |
|---|---|---|---|---|
| Democratic | Diana DeGette (incumbent) | 111,718 | 66.28% | |
| Republican | Ken Chlouber | 49,884 | 29.59% | |
| Green | Ken Seaman | 3,209 | 1.90% | |
| Libertarian | Kent Leonard | 2,584 | 1.53% | |
| Constitution | George C. Lilly | 1,169 | 0.69% | |
| Majority | 61,834 | 36.69% | ||
| Total votes | 168,564 | 100% | ||
| Democratic hold | ||||
2004
| Party | Candidate | Votes | % | |
|---|---|---|---|---|
| Democratic | Diana DeGette (incumbent) | 177,077 | 73.50% | |
| Republican | Roland Chicas | 58,659 | 24.35% | |
| Constitution | George C. Lilly | 5,193 | 2.16% | |
| Majority | 118,418 | 49.15% | ||
| Total votes | 240,929 | 100% | ||
| Democratic hold | ||||
2006
| Party | Candidate | Votes | % | |
|---|---|---|---|---|
| Democratic | Diana DeGette (incumbent) | 129,446 | 79.77% | |
| Green | Thomas D. Kelly | 32,825 | 20.23% | |
| Majority | 96,621 | 59.54% | ||
| Total votes | 162,271 | 100% | ||
| Democratic hold | ||||
2008
| Party | Candidate | Votes | % | |
|---|---|---|---|---|
| Democratic | Diana DeGette (incumbent) | 203,756 | 71.94% | |
| Republican | George C. Lilly | 67,346 | 23.78% | |
| Libertarian | Martin L. Buchanan | 12,136 | 4.28% | |
| Majority | 136,410 | 48.16% | ||
| Total votes | 283,249 | 100% | ||
| Democratic hold | ||||
2010
| Party | Candidate | Votes | % | |
|---|---|---|---|---|
| Democratic | Diana DeGette (incumbent) | 140,073 | 67.42% | |
| Republican | Mike Fallon | 59,747 | 28.76% | |
| Green | Gary Swing | 2,923 | 1.41% | |
| Libertarian | Clint Jones | 2,867 | 1.38% | |
| Constitution | Chris Styskal | 2,141 | 1.03% | |
| Majority | 80,326 | 38.66% | ||
| Total votes | 207,751 | 100% | ||
| Democratic hold | ||||
2012
| Party | Candidate | Votes | % | |
|---|---|---|---|---|
| Democratic | Diana DeGette (incumbent) | 237,579 | 68.23% | |
| Republican | Danny Stroud | 93,217 | 26.77% | |
| Libertarian | Frank Atwood | 12,585 | 3.61% | |
| Green | Gary Swing | 4,829 | 1.39% | |
| Majority | 144,362 | 41.46% | ||
| Total votes | 348,228 | 100% | ||
| Democratic hold | ||||
2014
| Party | Candidate | Votes | % | |
|---|---|---|---|---|
| Democratic | Diana DeGette (incumbent) | 183,281 | 65.81% | |
| Republican | Martin Walsh | 80,682 | 28.97% | |
| Libertarian | Frank Atwood | 9,292 | 3.34% | |
| Independent | Danny Stroud | 5,236 | 1.88% | |
| Majority | 102,599 | 36.84% | ||
| Total votes | 278,494 | 100% | ||
| Democratic hold | ||||
2016
| Party | Candidate | Votes | % | |
|---|---|---|---|---|
| Democratic | Diana DeGette (incumbent) | 257,254 | 67.87% | |
| Republican | Casper Stockham | 105,030 | 27.71% | |
| Libertarian | Frank Atwood | 16,752 | 4.42% | |
| Majority | 152,224 | 40.16% | ||
| Total votes | 379,036 | 100% | ||
| Democratic hold | ||||
2018
| Party | Candidate | Votes | % | |
|---|---|---|---|---|
| Democratic | Diana DeGette (incumbent) | 272,886 | 73.81% | |
| Republican | Casper Stockham | 85,207 | 23.05% | |
| Libertarian | Raymon Doane | 11,600 | 3.14% | |
| Majority | 187,679 | 50.76% | ||
| Total votes | 369,693 | 100.0% | ||
| Democratic hold | ||||
2020
| Party | Candidate | Votes | % | |
|---|---|---|---|---|
| Democratic | Diana DeGette (incumbent) | 331,621 | 73.65% | |
| Republican | Shane Bolling | 105,955 | 23.53% | |
| Libertarian | Kyle Furey | 8,749 | 1.94% | |
| Unity | Paul Noel Fiorino | 2,524 | 0.56% | |
| Approval Voting | Jan Kok | 1,441 | 0.32% | |
| Majority | 225,666 | 50.12% | ||
| Total votes | 450,290 | 100.0% | ||
| Democratic hold | ||||
2022
| Party | Candidate | Votes | % | |
|---|---|---|---|---|
| Democratic | Diana DeGette (incumbent) | 226,929 | 80.3 | |
| Republican | Jennifer Qualteri | 49,530 | 17.5 | |
| Libertarian | John Kittleson | 6,157 | 2.2 | |
| Green | Iris Boswell (write-in) | 70 | 0.0 | |
| Total votes | 282,686 | 100.0 | ||
| Democratic hold | ||||
Historical district boundaries
See also
References
- ↑ "Congressional Districts Relationship Files (State-based)". United States Census Bureau. Archived from the original on March 27, 2019. Retrieved January 24, 2021 – via Wayback Machine.
- ↑ "My Congressional District". United States Census Bureau. Powered by American Community Survey and County Business Patterns. Archived from the original on December 28, 2018. Retrieved October 5, 2023.
{{cite web}}: CS1 maint: others (link) - ↑ "My Congressional District". United States Census Bureau. Powered by American Community Survey and County Business Patterns. Archived from the original on December 28, 2018. Retrieved October 5, 2023.
{{cite web}}: CS1 maint: others (link) - 1 2 "2022 Cook PVI: District Map and List". Cook Political Report. Retrieved January 10, 2023.
- ↑ "Dave's Redistricting". Retrieved August 25, 2021.
- 1 2 3 4 5 6 7 8 9 10 11 12 13 14 15 16 17 18 19 "CO - District 01 - History". Our Campaigns. Archived from the original on July 15, 2018. Retrieved January 25, 2021.
- ↑ "Statistics of the Congressional Election of November 2, 1926" (PDF). Office of the Clerk, U.S. House of Representatives. Compiled from official sources by William Tyler Page. Archived (PDF) from the original on January 5, 2007. Retrieved January 28, 2021.
{{cite web}}: CS1 maint: others (link) - ↑ "Statistics of the Congressional and Presidential Election of November 6, 1928" (PDF). Office of the Clerk, U.S. House of Representatives. Compiled from official sources by William Tyler Page. March 25, 1929. Archived (PDF) from the original on January 5, 2007. Retrieved January 28, 2021.
{{cite web}}: CS1 maint: others (link) - ↑ "Statistics of the Congressional Election of November 4, 1930" (PDF). Office of the Clerk, U.S. House of Representatives. Compiled from official sources by William Tyler Page. January 8, 1931. Archived (PDF) from the original on January 5, 2007. Retrieved January 28, 2021.
{{cite web}}: CS1 maint: others (link) - ↑ "Statistics of the Congressional and Presidential Election of November 8, 1932" (PDF). Office of the Clerk, U.S. House of Representatives. Compiled from official sources by George D. Ellis under direction of South Trimble. February 3, 1933. Archived (PDF) from the original on January 5, 2007. Retrieved January 27, 2021.
{{cite web}}: CS1 maint: others (link) - ↑ "Statistics of the Congressional Election of November 6, 1934" (PDF). Office of the Clerk, U.S. House of Representatives. Compiled from official sources by Leroy D. Brandon under direction of South Trimble. April 11, 1935. Archived (PDF) from the original on January 5, 2007. Retrieved January 27, 2021.
{{cite web}}: CS1 maint: others (link) - ↑ "Statistics of the Congressional Election of November 3, 1936" (PDF). Office of the Clerk, U.S. House of Representatives. Compiled from official sources by Leroy D. Brandon under direction of South Trimble. December 18, 1936. Archived (PDF) from the original on January 5, 2007. Retrieved January 26, 2021.
{{cite web}}: CS1 maint: others (link) - ↑ "Statistics of the Congressional Election of November 8, 1938" (PDF). Office of the Clerk, U.S. House of Representatives. Compiled from official sources by Leroy D. Brandon under direction of South Trimble. July 29, 1940. Archived (PDF) from the original on January 5, 2007. Retrieved January 26, 2021.
{{cite web}}: CS1 maint: others (link) - ↑ "Statistics of the Presidential and Congressional Election of November 5, 1940" (PDF). Office of the Clerk, U.S. House of Representatives. Compiled from official sources by Leroy D. Brandon under direction of South Trimble. January 15, 1941. Archived (PDF) from the original on January 5, 2007. Retrieved January 26, 2021.
{{cite web}}: CS1 maint: others (link) - ↑ "Statistics of the Congressional Election of November 3, 1942" (PDF). Office of the Clerk, U.S. House of Representatives. Compiled from official sources by William Graf under direction of South Trimble. January 30, 1943. Archived (PDF) from the original on January 5, 2007. Retrieved January 25, 2021.
{{cite web}}: CS1 maint: others (link) - ↑ "Statistics of the Presidential and Congressional Election of November 7, 1944" (PDF). Office of the Clerk, U.S. House of Representatives. Compiled from official sources by William Graf under direction of South Trimble. March 1, 1945. Archived (PDF) from the original on January 5, 2007. Retrieved January 25, 2021.
{{cite web}}: CS1 maint: others (link) - ↑ "Statistics of the Congressional Election of November 5, 1946" (PDF). Office of the Clerk, U.S. House of Representatives. Compiled from official sources by William Graf under direction of John Andrews. February 1, 1947. Archived (PDF) from the original on January 5, 2007. Retrieved January 25, 2021.
{{cite web}}: CS1 maint: others (link) - ↑ "Statistics of the Presidential and Congressional Election of November 2, 1948" (PDF). Office of the Clerk, U.S. House of Representatives. Compiled from official sources by William Graf under direction of Ralph R. Roberts. March 1, 1949. Archived (PDF) from the original on January 5, 2007. Retrieved January 25, 2021.
{{cite web}}: CS1 maint: others (link) - ↑ "Statistics of the Congressional Election of November 7, 1950" (PDF). Office of the Clerk, U.S. House of Representatives. Compiled from official sources by William Graf under direction of Ralph R. Roberts. January 11, 1951. Archived (PDF) from the original on January 5, 2007. Retrieved January 25, 2021.
{{cite web}}: CS1 maint: others (link) - ↑ "Statistics of the Presidential and Congressional Election of November 4, 1952" (PDF). Office of the Clerk, U.S. House of Representatives. Compiled from official sources by Earl Rockwood under direction of Lyle O. Snader. May 12, 1953. Archived (PDF) from the original on January 5, 2007. Retrieved January 25, 2021.
{{cite web}}: CS1 maint: others (link) - ↑ "Statistics of the Congressional Election of November 2, 1954" (PDF). Office of the Clerk, U.S. House of Representatives. Compiled from official sources by Earl Rockwood under direction of Ralph R. Roberts. October 15, 1955. Archived (PDF) from the original on January 5, 2007. Retrieved January 25, 2021.
{{cite web}}: CS1 maint: others (link) - ↑ "Statistics of the Presidential and Congressional Election of November 6, 1956" (PDF). Office of the Clerk, U.S. House of Representatives. Compiled from official sources under direction of Ralph R. Roberts. September 15, 1958. Archived (PDF) from the original on January 5, 2007. Retrieved January 25, 2021.
{{cite web}}: CS1 maint: others (link) - ↑ "Statistics of the Congressional Election of November 4, 1958" (PDF). Office of the Clerk, U.S. House of Representatives. Compiled from official sources by Benjamin J. Guthrie, under direction of Ralph R. Roberts. March 16, 1959. Archived (PDF) from the original on January 5, 2007. Retrieved January 25, 2021.
{{cite web}}: CS1 maint: others (link) - ↑ "Statistics of the Presidential and Congressional Election of November 8, 1960" (PDF). Office of the Clerk, U.S. House of Representatives. Compiled from official sources by Benjamin J. Guthrie, under direction of Ralph R. Roberts. April 15, 1961. Archived (PDF) from the original on January 5, 2007. Retrieved January 25, 2021.
{{cite web}}: CS1 maint: others (link) - ↑ "Statistics of the Congressional Election of November 6, 1962" (PDF). Office of the Clerk, U.S. House of Representatives. Compiled from official sources by Benjamin J. Guthrie, under direction of Ralph R. Roberts. March 16, 1963. Archived (PDF) from the original on January 5, 2007. Retrieved January 24, 2021.
{{cite web}}: CS1 maint: others (link) - ↑ "Statistics of the Presidential and Congressional Election of November 3, 1964" (PDF). Office of the Clerk, U.S. House of Representatives. Compiled from official sources by Benjamin J. Guthrie, under direction of Ralph R. Roberts. August 15, 1965. Archived (PDF) from the original on January 5, 2007. Retrieved January 24, 2021.
{{cite web}}: CS1 maint: others (link) - ↑ "Statistics of the Congressional Election of November 8, 1966" (PDF). Office of the Clerk, U.S. House of Representatives. Compiled from official sources by Benjamin J. Guthrie, under direction of W. Pat Jennings. March 31, 1967. Archived (PDF) from the original on January 5, 2007. Retrieved January 24, 2021.
{{cite web}}: CS1 maint: others (link) - ↑ "Statistics of the Presidential and Congressional Election of November 5, 1968" (PDF). Office of the Clerk, U.S. House of Representatives. Compiled from official sources by Benjamin J. Guthrie, under direction of W. Pat Jennings. July 1, 1969. Archived (PDF) from the original on January 5, 2007. Retrieved January 24, 2021.
{{cite web}}: CS1 maint: others (link) - ↑ "Statistics of the Congressional Election of November 3, 1970" (PDF). Office of the Clerk, U.S. House of Representatives. Compiled from official sources by Benjamin J. Guthrie, under direction of W. Pat Jennings. May 1, 1971. Archived (PDF) from the original on January 5, 2007. Retrieved January 24, 2021.
{{cite web}}: CS1 maint: others (link) - ↑ "Statistics of the Presidential and Congressional Election of November 7, 1972" (PDF). Office of the Clerk, U.S. House of Representatives. Compiled from official sources by Benjamin J. Guthrie, under direction of W. Pat Jennings. March 15, 1973. Archived (PDF) from the original on January 5, 2007. Retrieved January 24, 2021.
{{cite web}}: CS1 maint: others (link) - ↑ "Statistics of the Congressional Election of November 4, 1974" (PDF). Office of the Clerk, U.S. House of Representatives. Compiled from official sources by Benjamin J. Guthrie, under direction of W. Pat Jennings. August 1, 1975. Archived (PDF) from the original on January 5, 2007. Retrieved January 24, 2021.
{{cite web}}: CS1 maint: others (link) - ↑ "Statistics of the Presidential and Congressional Election of November 2, 1976" (PDF). Office of the Clerk, U.S. House of Representatives. Compiled from official sources by Benjamin J. Guthrie, under direction of Edmund L. Henshaw, Jr. April 15, 1977. Archived (PDF) from the original on January 5, 2007. Retrieved January 24, 2021.
{{cite web}}: CS1 maint: others (link) - ↑ "Statistics of the Congressional Election of November 7, 1978" (PDF). Office of the Clerk, U.S. House of Representatives. Compiled from official sources by Benjamin J. Guthrie, under direction of Edmund L. Henshaw, Jr. April 1, 1979. Archived (PDF) from the original on January 5, 2007. Retrieved January 24, 2021.
{{cite web}}: CS1 maint: others (link) - ↑ "Statistics of the Presidential and Congressional Election of November 4, 1980" (PDF). Office of the Clerk, U.S. House of Representatives. Compiled from official sources by Thomas E. Ladd, under direction of Edmund L. Henshaw, Jr. April 15, 1981. Archived (PDF) from the original on January 5, 2007. Retrieved January 23, 2021.
{{cite web}}: CS1 maint: others (link) - ↑ "Statistics of the Congressional Election of November 2, 1982" (PDF). Office of the Clerk, U.S. House of Representatives. Compiled from official sources by Thomas E. Ladd, under direction of Benjamin J. Guthrie. May 5, 1983. Archived (PDF) from the original on January 5, 2007. Retrieved January 23, 2021.
{{cite web}}: CS1 maint: others (link) - ↑ "Statistics of the Presidential and Congressional Election of November 6, 1984" (PDF). Office of the Clerk, U.S. House of Representatives. Compiled from official sources by Thomas E. Ladd., under direction of Benjamin J. Guthrie. May 1, 1985. Archived (PDF) from the original on January 5, 2007. Retrieved January 23, 2021.
{{cite web}}: CS1 maint: others (link) - ↑ "Statistics of the Congressional Election of November 4, 1986" (PDF). Office of the Clerk, U.S. House of Representatives. Compiled from official sources by Dallas L. Dendy, Jr., under direction of Donnald K. Anderson. May 29, 1987. Archived (PDF) from the original on January 5, 2007. Retrieved January 23, 2021.
{{cite web}}: CS1 maint: others (link) - ↑ "Statistics of the Presidential and Congressional Election of November 8, 1988" (PDF). Office of the Clerk, U.S. House of Representatives. Compiled from official sources by Dallas L. Dendy, Jr., under direction of Donnald K. Anderson. April 20, 1989. Archived (PDF) from the original on January 5, 2007. Retrieved January 23, 2021.
{{cite web}}: CS1 maint: others (link) - ↑ "Statistics of the Congressional Election of November 6, 1990" (PDF). Office of the Clerk, U.S. House of Representatives. Compiled from official sources by Dallas L. Dendy, Jr., under direction of Donnald K. Anderson. April 29, 1991. Archived (PDF) from the original on January 5, 2007. Retrieved January 23, 2021.
{{cite web}}: CS1 maint: others (link) - ↑ "Statistics of the Presidential and Congressional Election of November 3, 1992" (PDF). Office of the Clerk, U.S. House of Representatives. Compiled from official sources by Dallas L. Dendy, Jr., under direction of Donnald K. Anderson. May 31, 1993. Archived (PDF) from the original on January 5, 2007. Retrieved January 23, 2021.
{{cite web}}: CS1 maint: others (link) - ↑ "Statistics of the Congressional Election of November 8, 1994" (PDF). Office of the Clerk, U.S. House of Representatives. Compiled from official sources by Robin H. Carle. May 12, 1995. Archived (PDF) from the original on January 5, 2007. Retrieved January 23, 2021.
{{cite web}}: CS1 maint: others (link) - ↑ "Statistics of the Presidential and Congressional Election of November 5, 1996" (PDF). Office of the Clerk, U.S. House of Representatives. Compiled from official sources by Robin H. Carle. July 29, 1997. Archived (PDF) from the original on January 5, 2007. Retrieved January 23, 2021.
{{cite web}}: CS1 maint: others (link) - ↑ "Statistics of the Congressional Election of November 3, 1998" (PDF). Office of the Clerk, U.S. House of Representatives. Compiled from official sources by Jeff Trandahl. January 3, 1999. Archived (PDF) from the original on January 5, 2007. Retrieved January 23, 2021.
{{cite web}}: CS1 maint: others (link) - ↑ "Statistics of the Congressional and Presidential Election of November 7, 2002" (PDF). Office of the Clerk, U.S. House of Representatives. Compiled from official sources by Jeff Trandahl. June 21, 2001. Archived (PDF) from the original on January 5, 2007. Retrieved January 23, 2021.
{{cite web}}: CS1 maint: others (link) - ↑ "Statistics of the Congressional Election of November 5, 2002" (PDF). Office of the Clerk, U.S. House of Representatives. Compiled from official sources by Jeff Trandahl. May 1, 2003. Archived (PDF) from the original on January 5, 2007. Retrieved January 22, 2021.
{{cite web}}: CS1 maint: others (link) - ↑ "Statistics of the Presidential and Congressional Election of November 2, 2004" (PDF). Office of the Clerk, U.S. House of Representatives. Compiled from official sources by Jeff Trandahl. June 7, 2005. Archived (PDF) from the original on January 5, 2007. Retrieved January 22, 2021.
{{cite web}}: CS1 maint: others (link) - ↑ "Statistics of the Congressional Election of November 7, 2006" (PDF). Office of the Clerk, U.S. House of Representatives. Compiled from official sources by Lorraine C. Miller. September 21, 2007. Archived (PDF) from the original on August 15, 2007. Retrieved January 22, 2001.
{{cite web}}: CS1 maint: others (link) - ↑ "Statistics of the Presidential and Congressional Election of November 4, 2008" (PDF). Office of the Clerk, U.S. House of Representatives. Compiled from official sources by Lorraine C. Miller. July 10, 2009. Archived (PDF) from the original on July 30, 2009. Retrieved January 22, 2021.
{{cite web}}: CS1 maint: others (link) - ↑ "Statistics of the Congressional Election of November 2, 2010" (PDF). Office of the Clerk, U.S. House of Representatives. Compiled from official sources by Karen L. Haas. June 3, 2011. Archived (PDF) from the original on August 7, 2011. Retrieved January 22, 2021.
{{cite web}}: CS1 maint: others (link) - ↑ "Statistics of the Presidential and Congressional Election of November 6, 2012" (PDF). Office of the Clerk, U.S. House of Representatives. Compiled from official sources by Karen L. Haas. February 28, 2013. Archived (PDF) from the original on May 9, 2013. Retrieved January 22, 2021.
{{cite web}}: CS1 maint: others (link) - ↑ "Official Results November 4, 2014 General Election". Colorado Election Results. Colorado Secretary of State. Archived from the original on December 26, 2014. Retrieved January 22, 2021.
- ↑ "Official Certified Results November 8, 2016 General Election". Colorado Election Results. Colorado Secretary of State. Archived from the original on December 15, 2016. Retrieved January 22, 2021.
- ↑ "2018 General Certification and Results" (PDF). Colorado Secretary of State. Archived (PDF) from the original on October 18, 2020. Retrieved January 22, 2021.
- ↑ "Certificate - General Election Statewide Abstract of Votes Cast" (PDF). Colorado Secretary of State. Archived (PDF) from the original on December 14, 2020. Retrieved January 22, 2021.
- ↑ "Certificate & Results - General Election Statewide Abstract of Votes Cast" (PDF). Colorado Secretary of State.
- Martis, Kenneth C. (1989). The Historical Atlas of Political Parties in the United States Congress. New York: Macmillan Publishing Company.
- Martis, Kenneth C. (1982). The Historical Atlas of United States Congressional Districts. New York: Macmillan Publishing Company.
- Congressional Biographical Directory of the United States 1774–present