| Connecticut's 4th congressional district | |||
|---|---|---|---|
Interactive map of district boundaries since January 3, 2023 | |||
| Representative |
| ||
| Area | 539 sq mi (1,400 km2) | ||
| Distribution |
| ||
| Population (2022) | 710,465 | ||
| Median household income | $106,972[1] | ||
| Ethnicity |
| ||
| Cook PVI | D+13[2] | ||
.svg.png.webp)
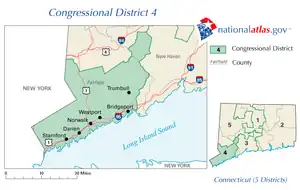
Connecticut's 4th congressional district is a congressional district in the U.S. state of Connecticut. Located in the southwestern part of the state, the district is largely suburban and extends from Bridgeport, the largest city in the state, to Greenwich – an area largely coextensive with the Connecticut side of the New York metropolitan area. The district also extends inland, toward Danbury and toward the Lower Naugatuck Valley.
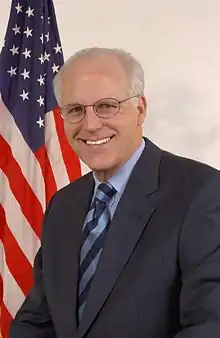
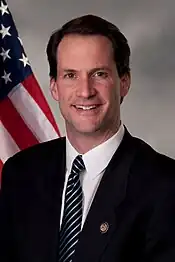
The district is currently represented by Democrat Jim Himes. With a Cook Partisan Voting Index rating of D+13, it is the most Democratic district in Connecticut, a state with an all-Democratic congressional delegation.[2] Historically, the 4th was a classic "Yankee Republican" district. However, it has not supported a Republican for president since 1988, and has swung increasingly Democratic at the national level since the 1990s. This culminated in 2020, when Joe Biden won it with 64 percent of the vote, his best showing in the state.
However, even as the district swung increasingly Democratic at the national level, Republicans usually held this district without serious difficulty until the turn of the millennium. In 2004, however, Democrat Diane Farrell held longtime incumbent Chris Shays to only 52 percent of the vote, the closest race in the district in 30 years. Shays fended off an equally spirited challenge from Farrell in 2006 before losing to Himes in 2008. Himes has held the seat ever since.
Towns in the district
The district includes the following towns:
Fairfield County – Bridgeport, Darien, Easton, Fairfield, Greenwich, Monroe, New Canaan, Norwalk, Redding, Ridgefield, Shelton (part), Stamford, Trumbull, Weston, Westport, and Wilton.
New Haven County – Oxford.
Voter registration
| Voter registration and party enrollment as of October 30, 2012[3] | |||||
|---|---|---|---|---|---|
| Party | Active | Inactive | Total | Percentage | |
| Democratic | 141,355 | 9,427 | 150,782 | 36.17% | |
| Republican | 98,663 | 5,106 | 103,769 | 24.89% | |
| Minor Parties | 3,737 | 312 | 4,049 | 0.97% | |
| Unaffiliated | 146,218 | 12,043 | 158,261 | 37.97% | |
| Total | 389,973 | 26,888 | 416,861 | 100.00% | |
Recent presidential elections
| Election results from presidential races | ||
|---|---|---|
| Year | Office | Results |
| 2000 | President | Gore 55–41% |
| 2004 | President | Kerry 52–46% |
| 2008 | President | Obama 60–40% |
| 2012 | President | Obama 55–44% |
| 2016 | President | Clinton 60–37% |
| 2020 | President | Biden 64–35% |
Recent elections
1987 (special)
| Party | Candidate | Votes | % | ±% | |
|---|---|---|---|---|---|
| Republican | Christopher Shays | 50,518 | 57% | ||
| Democratic | Christine Niedermeier | 37,293 | 42% | ||
| Republican hold | Swing | ||||
| Turnout | 87,811 | 100% | |||
1988
| Party | Candidate | Votes | % | ±% | |
|---|---|---|---|---|---|
| Republican | Christopher Shays (incumbent) | 147,843 | 72% | ||
| Democratic | Roger J. Pearson | 55,751 | 27% | ||
| Republican hold | Swing | ||||
| Turnout | 203,594 | 100% | |||
1990
| Party | Candidate | Votes | % | ±% | |
|---|---|---|---|---|---|
| Republican | Christopher Shays (incumbent) | 105,682 | 77% | ||
| Democratic | Al Smith | 32,352 | 23% | ||
| Republican hold | Swing | ||||
| Turnout | 138,034 | 100% | |||
1992
| Party | Candidate | Votes | % | ±% | |
|---|---|---|---|---|---|
| Republican | Christopher Shays (incumbent) | 147,816 | 67% | ||
| Democratic | Dave Schropfer | 58,666 | 27% | ||
| A Connecticut Party (1990) | Al Smith | 11,679 | 5% | ||
| Natural Law | Ronald M. Fried | 1,445 | 1% | ||
| Republican hold | Swing | ||||
| Turnout | 219,606 | 100% | |||
1994
| Party | Candidate | Votes | % | ±% | |
|---|---|---|---|---|---|
| Republican | Christopher Shays (incumbent) | 109,436 | 74% | ||
| Democratic | Jonathan Kantrowitz | 34,962 | 24% | ||
| Libertarian | Irving Sussman | 1,976 | 1% | ||
| Natural Law | Terry M. Nevas | 688 | 0.47% | ||
| Republican hold | Swing | ||||
| Turnout | 147,062 | 100% | |||
1996
| Party | Candidate | Votes | % | ±% | |
|---|---|---|---|---|---|
| Republican | Christopher Shays (incumbent) | 121,949 | 60% | ||
| Democratic | William Finch | 75,902 | 38% | ||
| Libertarian | Edward H. Tonkin | 2,815 | 1% | ||
| Natural Law | Terry M. Nevas | 1,046 | 1% | ||
| Republican hold | Swing | ||||
| Turnout | 201,712 | 100% | |||
1998
| Party | Candidate | Votes | % | ±% | |
|---|---|---|---|---|---|
| Republican | Christopher Shays (incumbent) | 94,767 | 69% | ||
| Democratic | Jonathan Kantrowitz | 40,988 | 28% | ||
| Libertarian | Marshall C. Harrison | 1,449 | 1% | ||
| Republican hold | Swing | ||||
| Turnout | 137,204 | 100% | |||
2000
| Party | Candidate | Votes | % | ±% | |
|---|---|---|---|---|---|
| Republican | Christopher Shays (incumbent) | 119,155 | 58% | ||
| Democratic | Stephanie Sanchez | 84,472 | 41% | ||
| Libertarian | Daniel Gislao | 2,034 | 1% | ||
| Independent | Frank M. Don | 1,097 | 0.53% | ||
| Republican hold | Swing | ||||
| Turnout | 206,758 | 100% | |||
2002
| Party | Candidate | Votes | % | ±% | |
|---|---|---|---|---|---|
| Republican | Christopher Shays (incumbent) | 113,197 | 64% | ||
| Democratic | Stephanie Sanchez | 62,491 | 36% | ||
| Republican hold | Swing | ||||
| Turnout | 175,688 | 100% | |||
2004
| Party | Candidate | Votes | % | ±% | |
|---|---|---|---|---|---|
| Republican | Christopher Shays (incumbent) | 149,891 | 52% | ||
| Democratic | Diane Farrell | 136,481 | 48% | ||
| Republican hold | Swing | ||||
| Turnout | 286,372 | 100% | |||
2006
| Party | Candidate | Votes | % | ±% | |
|---|---|---|---|---|---|
| Republican | Christopher Shays (incumbent) | 106,510 | 51% | ||
| Democratic | Diane Farrell | 99,450 | 48% | ||
| Libertarian | Phil Maymin | 3,058 | 1% | ||
| Republican hold | Swing | ||||
| Turnout | 209,018 | 100% | |||
2008
| Party | Candidate | Votes | % | ±% | |
|---|---|---|---|---|---|
| Democratic | Jim Himes | 159,694 | 51% | ||
| Republican | Christopher Shays (incumbent) | 147,356 | 47% | ||
| Libertarian | Michael A. Carrano | 2,036 | 1% | ||
| Green | Richard Z. Duffee | 1,377 | 0.44% | ||
| Turnout | 310,463 | 100% | |||
| Democratic gain from Republican | Swing | ||||
2010
| Party | Candidate | Votes | % | ±% | |
|---|---|---|---|---|---|
| Democratic | Jim Himes (incumbent) | 115,351 | 53% | ||
| Republican | Daniel Debicella | 102,030 | 47% | ||
| Turnout | 217,381 | 100% | |||
| Democratic hold | Swing | ||||
2012
| Party | Candidate | Votes | % | ±% | |
|---|---|---|---|---|---|
| Democratic | Jim Himes (incumbent) | 174,461 | 60% | ||
| Republican | Steve Obsitnik | 117,463 | 40% | ||
| Turnout | 291,924 | 100% | |||
| Democratic hold | Swing | ||||
2014
| Party | Candidate | Votes | % | ±% | |
|---|---|---|---|---|---|
| Democratic | Jim Himes (incumbent) | 106,873 | 54% | ||
| Republican | Dan Debicella | 91,922 | 46% | ||
| Turnout | 198,800 | 100% | |||
| Democratic hold | Swing | ||||
2016
| Party | Candidate | Votes | % | ±% | |
|---|---|---|---|---|---|
| Democratic | Jim Himes (incumbent) | 185,928 | 60% | ||
| Republican | John Shaban | 123,630 | 40% | ||
| Turnout | 309,558 | 100% | |||
| Democratic hold | Swing | ||||
2018
| Party | Candidate | Votes | % | ±% | |
|---|---|---|---|---|---|
| Democratic | Jim Himes (incumbent) | 168,726 | 61% | ||
| Republican | Harry Arora | 106,921 | 38% | ||
| Turnout | 275,651 | 100% | |||
| Democratic hold | Swing | ||||
2020
| Party | Candidate | Votes | % | ±% | |
|---|---|---|---|---|---|
| Democratic | Jim Himes (incumbent) | 223,832 | 62% | ||
| Republican | Jonathan Riddle | 130,627 | 36% | ||
| Independent | Brian Merlen | 5,656 | 1% | ||
| Write-in | N/A | 10 | 0% | ||
| Turnout | 360,125 | 100% | |||
| Democratic hold | Swing | ||||
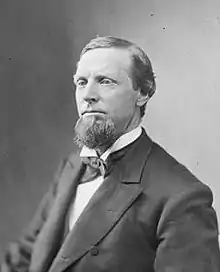
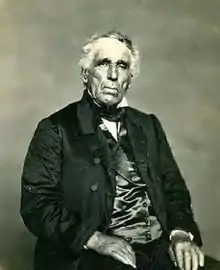
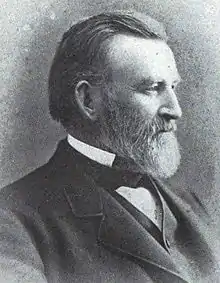
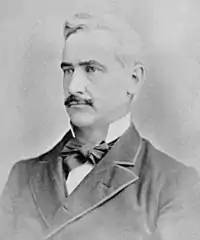
List of members representing the district
.jpg.webp)
.jpg.webp)
.tif.png.webp)
See also
References
- Notes
- ↑ "My Congressional District".
- 1 2 "2022 Cook PVI: District Map and List". Cook Political Report. Retrieved January 10, 2023.
- ↑ "Registration and Party Enrollment Statistics as of October 30, 2012" (PDF). Connecticut Secretary of State. Archived from the original (PDF) on September 23, 2006. Retrieved October 30, 2012.
- Bibliography
- Martis, Kenneth C. (1989). The Historical Atlas of Political Parties in the United States Congress. New York: Macmillan Publishing Company.
- Martis, Kenneth C. (1982). The Historical Atlas of United States Congressional Districts. New York: Macmillan Publishing Company.
- Congressional Biographical Directory of the United States 1774–present