| Cher's 1st constituency | |
|---|---|
| Constituency for the National Assembly | |
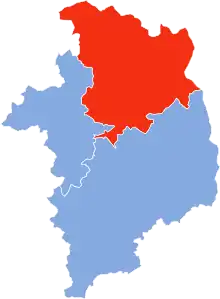 Boundary of Cher's 1st constituency in Cher | |
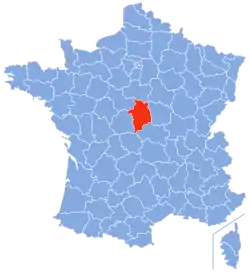 Location of Cher within France | |
| Department | Cher |
| Region | Centre-Val de Loire |
| Population | 99,542 (2013)[1] |
| Electorate | 72,563 (2017)[2] |
| Current constituency | |
| Deputy | François Cormier-Bouligeon |
| Political party | RE |
| Parliamentary group | RE |
Cher's 1st constituency is one of three French legislative constituencies in the department of Cher. It is currently represented by François Cormier-Bouligeon of Renaissance (RE).
Historic representation
| Legislature | Start of mandate | End of mandate | Deputy | Party | |
|---|---|---|---|---|---|
| 1st | 9 December 1958 | 9 October 1962 | Raymond Boisdé | CNI | |
| 2nd | 6 December 1962 | 2 April 1967 | RI | ||
| 3rd | 3 April 1967 | 30 May 1968 | |||
| 4th | 11 July 1968 | 1 April 1973 | |||
| 5th | 2 April 1973 | 2 April 1978 | |||
| 6th | 3 April 1978 | 6 May 1978 | Jean-François Deniau | UDF | |
| 7 May 1978 | 22 May 1981 | Henri Moulle | |||
| 7th | 2 July 1981 | 1 April 1986 | Jacques Rimbault | PCF | |
| 8th | 2 April 1986 | 14 May 1988 | Proportional representation | ||
| 9th | 23 June 1988 | 1 April 1993 | Jean-François Deniau | UDF | |
| 10th | 2 April 1993 | 21 April 1997 | |||
| 11th | 12 June 1997 | 18 June 2002 | Yves Fromion | RPR | |
| 12th | 19 June 2002 | 19 June 2007 | UMP | ||
| 13th | 20 June 2007 | 19 June 2012 | |||
| 14th | 20 June 2012 | 20 June 2017 | |||
| 15th | 21 June 2017 | 21 June 2022 | François Cormier-Bouligeon | LREM | |
| 16th | 22 June 2022 | ongoing | RE | ||
Elections
2022
| Party | Candidate | Votes | % | ±% | |
|---|---|---|---|---|---|
| LREM (Ensemble) | François Cormier-Bouligeon | 11,113 | 32.14 | -4.16 | |
| PS (NUPÉS) | Alex Charpentier | 8,370 | 24.20 | +0.49 | |
| RN | Julie Apricena | 7,591 | 21.95 | +8.02 | |
| LR (UDC) | David Dallois | 4,669 | 13.50 | -7.18 | |
| REC | Adrien-Laurent Bernelle | 1,660 | 4.80 | N/A | |
| LO | Sylvie Cerveau | 607 | 1.76 | +0.47 | |
| The Patriots (UPF) | Karine Bèringer | 571 | 1.65 | N/A | |
| Turnout | 34,581 | 49.92 | -0.78 | ||
| 2nd round result | |||||
| LREM (Ensemble) | François Cormier-Bouligeon | 17,117 | 57.14 | +0.93 | |
| PS (NUPÉS) | Alex Charpentier | 12,840 | 42.86 | N/A | |
| Turnout | 29,957 | 46.91 | +3.19 | ||
| LREM hold | |||||
2017
| Candidate | Label | First round | Second round | |||
|---|---|---|---|---|---|---|
| Votes | % | Votes | % | |||
| François Cormier-Bouligeon | REM | 12,977 | 36.30 | 15,397 | 56.21 | |
| Wladimir d'Ormesson | LR | 7,393 | 20.68 | 11,996 | 43.79 | |
| Jean-René Coueille | FN | 4,981 | 13.93 | |||
| Frédéric Renard | FI | 4,793 | 13.41 | |||
| Céline Bezoui | PS | 2,501 | 7.00 | |||
| Françoise Pouzet | ECO | 1,181 | 3.30 | |||
| Laurent Sorcelle | UDI | 1,095 | 3.06 | |||
| Sylvie Cerveau | EXG | 463 | 1.29 | |||
| Romain Guillaume | DIV | 369 | 1.03 | |||
| Votes | 35,753 | 100.00 | 27,393 | 100.00 | ||
| Valid votes | 35,753 | 97.20 | 27,393 | 86.34 | ||
| Blank votes | 844 | 2.29 | 3,446 | 10.86 | ||
| Null votes | 186 | 0.51 | 889 | 2.80 | ||
| Turnout | 36,783 | 50.70 | 31,728 | 43.72 | ||
| Abstentions | 35,762 | 49.30 | 40,835 | 56.28 | ||
| Registered voters | 72,545 | 72,563 | ||||
| Source: Ministry of the Interior | ||||||
2012
| Candidate | Party | First round | Second round | ||||||||
|---|---|---|---|---|---|---|---|---|---|---|---|
| Votes | % | Votes | % | ||||||||
| Yves Fromion | UMP | 14,546 | 33.89% | 21,058 | 50.52% | ||||||
| Céline Bezoui | PS | 13,331 | 31.06% | 20,622 | 49.48% | ||||||
| Danielle Avon | FN | 5,255 | 12.24% | ||||||||
| Yannick Bedin | FG | 4,297 | 10.01% | ||||||||
| David Dallois | PLD | 2,545 | 5.93% | ||||||||
| Philippe Redois | EELV | 1,061 | 2.47% | ||||||||
| Philippe Bensac | NC | 991 | 2.31% | ||||||||
| Jérôme Leroy | DLR | 389 | 0.91% | ||||||||
| Sylvie Cerveau | LO | 329 | 0.77% | ||||||||
| Marie Avril | NPA | 174 | 0.41% | ||||||||
| Valid votes | 42,918 | 98.21% | 41,680 | 96.20% | |||||||
| Spoilt and null votes | 783 | 1.79% | 1,648 | 3.80% | |||||||
| Votes cast / turnout | 43,701 | 59.36% | 43,328 | 58.89% | |||||||
| Abstentions | 29,918 | 40.64% | 30,242 | 41.11% | |||||||
| Registered voters | 73,619 | 100.00% | 73,570 | 100.00% | |||||||
2007
| Party | Candidate | Votes | % | ±% | |||
|---|---|---|---|---|---|---|---|
| UMP | Yves Fromion | 20,505 | 46.35 | ||||
| PS | Irène Felix | 10,921 | 24.69 | ||||
| MoDem | Alain Tanton | 3,604 | 8.15 | ||||
| PCF | Yannick Bedin | 2,335 | 5.28 | ||||
| FN | Jean d'Ogny | 2,187 | 4.94 | ||||
| LV | Roger Ledoux | 1,411 | 3.19 | ||||
| Others | N/A | 3,276 | |||||
| Turnout | 45,170 | 60.22 | |||||
| 2nd round result | |||||||
| UMP | Yves Fromion | 24,193 | 55.92 | ||||
| PS | Irène Felix | 19,070 | 44.08 | ||||
| Turnout | 44,617 | 59.49 | |||||
| UMP hold | |||||||
2002
| Party | Candidate | Votes | % | ±% | |||
|---|---|---|---|---|---|---|---|
| UMP | Yves Fromion | 20,530 | 43.84 | ||||
| LV | Roger Ledoux | 11,834 | 25.27 | ||||
| FN | Jean d'Ogny | 5,626 | 12.01 | ||||
| DVD | Marie-Christine Fossier | 2,937 | 6.27 | ||||
| LO | Sylvie Cerveau | 1,527 | 3.26 | ||||
| LMR | Gerard Fremion | 1,319 | 2.82 | ||||
| MRC | Jean-Francois Babouin | 1,221 | 2.61 | ||||
| Others | N/A | 1,833 | |||||
| Turnout | 48,109 | 64.82 | |||||
| 2nd round result | |||||||
| UMP | Yves Fromion | 25,822 | 60.32 | ||||
| LV | Roger Ledoux | 16,984 | 39.68 | ||||
| Turnout | 44,586 | 60.08 | |||||
| UMP hold | |||||||
1997
| Party | Candidate | Votes | % | ±% | |||
|---|---|---|---|---|---|---|---|
| RPR | Yves Fromion | 15,646 | 32.83 | ||||
| PS | Roland Hodel | 9,537 | 20.01 | ||||
| PCF | Maxime Camuzat | 8,764 | 18.39 | ||||
| FN | Jean d'Ogny | 6,586 | 13.82 | ||||
| LO | Sylvie Cerveau | 1,809 | 3.80 | ||||
| MPF | Yves Roussel | 1,762 | 3.70 | ||||
| LV | Joel Crotté | 1,361 | 2.86 | ||||
| GE | Paulin Paris | 1,267 | 2.66 | ||||
| Others | N/A | 923 | |||||
| Turnout | 50,411 | 68.39 | |||||
| 2nd round result | |||||||
| RPR | Yves Fromion | 25,410 | 50.76 | ||||
| PS | Roland Hodel | 24,649 | 49.24 | ||||
| Turnout | 53,535 | 72.67 | |||||
| RPR gain from UDF | |||||||
References
- ↑ "Populations légales des circonscriptions législatives pour les élections de 2017". Institut national de la statistique et des études économiques. 1 December 2016. Retrieved 9 February 2018.
- ↑ "Résultats des élections législatives 2017". Ministère de l'Intérieur. 18 June 2017. Retrieved 9 February 2018.
- ↑ "Résultats des élections législatives 2022 dans le Cher". Le Monde.fr (in French). Retrieved 7 July 2022.
- ↑ "Résultats des élections législatives 2012" [Results of 2012 Legislative Election] (in French). Ministry of the Interior.
External links
- Results of legislative elections from 2002 to 2017 by constituency (Ministry of the Interior) (in French)
- Results of legislative elections from 1958 to 2012 by constituency (CDSP Sciences Po) (in French)
- Results of elections from 1958 to present by constituency (data.gouv.fr) (in French)
This article is issued from Wikipedia. The text is licensed under Creative Commons - Attribution - Sharealike. Additional terms may apply for the media files.