| 4th constituency of the Côtes-d'Armor | |
|---|---|
inline National Assembly of France | |
 Constituency in department | |
 | |
| Deputy | |
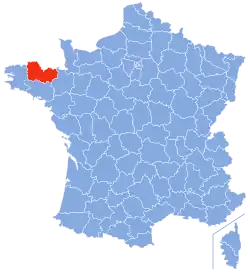
| Department | Côtes-d'Armor |
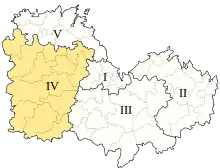
| Cantons | Bégard, Belle-Isle-en-Terre, Bourbriac, Callac, Gouarec, Guingamp, Lanvollon, Maël-Carhaix, Plestin-les-Grèves, Plouagat, Plouaret, Rostrenen, Saint-Nicolas-du-Pélem |
The 4th constituency of the Côtes-d'Armor is a French legislative constituency in the Côtes-d'Armor department (French: département). Like the other 576 French constituencies, it elects one MP using the two-round system, with a run-off if no candidate receives over 50% of the vote in the first round.
Deputies
| Election | Member | Party | |
|---|---|---|---|
| 1958 | Alain Le Guen | MRP | |
| 1962 | |||
| 1967 | Édouard Ollivro | CD | |
| 1968 | |||
| 1973 | |||
| 1978 | François Leizour | PCF | |
| 1981 | Maurice Briand | PS | |
| 1986 | Proportional representation - no election by constituency | ||
| 1988 | Maurice Briand | PS | |
| 1993 | Daniel Pennec | RPR | |
| 1997 | Félix Leyzour | PCF | |
| 2002 | Marie-Renée Oget | PS | |
| 2007 | |||
| 2012 | Annie Le Houérou | DVG | |
| 2017 | Yannick Kerlogot | LREM | |
| 2022 | Murielle Lepvraud | LFI | |
Election results
2022
| Party | Candidate | Votes | % | ±% | |||
|---|---|---|---|---|---|---|---|
| LFI (NUPÉS) | Murielle Lepvraud | 11,852 | 27.21 | -15.97 | |||
| LREM (Ensemble) | Yannick Kerlogot | 11,296 | 25.93 | -8.57 | |||
| RN | Noël Lude | 7,027 | 16.13 | +6.67 | |||
| PS | Alain Gueguen* | 5,552 | 12.75 | N/A | |||
| LR (UDC) | Jean-Paul Prigent | 2,964 | 6.80 | -0.48 | |||
| DVG | Arnaud Toudic | 1,391 | 3.19 | N/A | |||
| REC | Edwige Vinceleux | 1,189 | 2.73 | N/A | |||
| Others | N/A | 2,291 | 5.26 | ||||
| Turnout | 43,562 | 55.15 | -2.98 | ||||
| 2nd round result | |||||||
| LFI (NUPÉS) | Murielle Lepvraud | 21,716 | 53.42 | +3.91 | |||
| LREM (Ensemble) | Yannick Kerlogot | 18,939 | 46.59 | -3.91 | |||
| Turnout | 40,655 | 54.59 | |||||
| LFI gain from LREM | |||||||
* PS dissident
2017
| Candidate | Label | First round | Second round | |||
|---|---|---|---|---|---|---|
| Votes | % | Votes | % | |||
| Yannick Kerlogot | REM | 15,412 | 34.50 | 18,053 | 50.49 | |
| Annie Le Houérou | PS | 8,093 | 18.12 | 17,705 | 49.51 | |
| Murielle Lepvraud | FI | 4,925 | 11.03 | |||
| Cinderella Bernard | PCF | 4,639 | 10.38 | |||
| Sandrine Madec | FN | 4,224 | 9.46 | |||
| Martine Tison | LR | 3,251 | 7.28 | |||
| Sylvie Bourbigot | ECO | 1,630 | 3.65 | |||
| Jean-Pierre Le Neun | REG | 963 | 2.16 | |||
| Thierry Perennes | EXG | 510 | 1.14 | |||
| Jean-François Le Bihan | REG | 387 | 0.87 | |||
| Sylvie Lironcourt | EXG | 339 | 0.76 | |||
| Nicolas Noël | DIV | 298 | 0.67 | |||
| Votes | 44,671 | 100.00 | 35,758 | 100.00 | ||
| Valid votes | 44,671 | 97.63 | 35,758 | 89.69 | ||
| Blank votes | 698 | 1.53 | 2,581 | 6.47 | ||
| Null votes | 386 | 0.84 | 1,529 | 3.84 | ||
| Turnout | 45,755 | 58.13 | 39,868 | 50.66 | ||
| Abstentions | 32,952 | 41.87 | 38,822 | 49.34 | ||
| Registered voters | 78,707 | 78,690 | ||||
| Source: Ministry of the Interior[1] | ||||||
2012
| Candidate | Party | First round | Second round | ||||||||
|---|---|---|---|---|---|---|---|---|---|---|---|
| Votes | % | Votes | % | ||||||||
| Annie Le Houerou | PS dissident | 16,312 | 32.02% | 32,487 | 68.52% | ||||||
| Valérie Garcia | UMP | 9,313 | 18.28% | 14,926 | 31.48% | ||||||
| Gérard Lahellec | FG | 8,457 | 16.60% | ||||||||
| Michel Balbot | EELV–PS | 6,327 | 12.42% | ||||||||
| Pierre Salliou | MoDem | 4,791 | 9.41% | ||||||||
| Catherine Blein | FN | 3,676 | 7.22% | ||||||||
| Maïwenn Salomon | Breizhistance | 711 | 1.40% | ||||||||
| Marine Voisin | ?? | 491 | 0.96% | ||||||||
| Marie-Pierre Menguy | LO | 359 | 0.70% | ||||||||
| Thierry Richard | 254 | 0.50% | |||||||||
| Isabelle Montillet | MPF | 248 | 0.49% | ||||||||
| Valid votes | 50,939 | 98.35% | 47,413 | 94.87% | |||||||
| Spoilt and null votes | 852 | 1.65% | 2,565 | 5.13% | |||||||
| Votes cast / turnout | 51,791 | 65.05% | 49,978 | 62.76% | |||||||
| Abstentions | 27,831 | 34.95% | 29,654 | 37.24% | |||||||
| Registered voters | 79,622 | 100.00% | 79,632 | 100.00% | |||||||
2007
| Party | Candidate | Votes | % | ±% | |
|---|---|---|---|---|---|
| PS | Marie-Renée Oget | 33,068 | 63.22 | ||
| UMP | Marie-Élisabeth Bague | 19,241 | 36.78 | ||
| Turnout | 53,971 | 67.56 | |||
| PS hold | Swing | ||||
Sources
- Official results of French elections from 1998: "Résultats électoraux officiels en France" (in French). Archived from the original on 20 December 2011. Retrieved 20 June 2008.
- ↑ "Résultats des élections législatives 2017" [Results of 2017 Legislative Election] (in French). Ministry of the Interior.
- ↑ "Résultats des élections législatives 2012" [Results of 2012 Legislative Election] (in French). Ministry of the Interior.
This article is issued from Wikipedia. The text is licensed under Creative Commons - Attribution - Sharealike. Additional terms may apply for the media files.