| 1st constituency of Eure | |
|---|---|
inline National Assembly of France | |
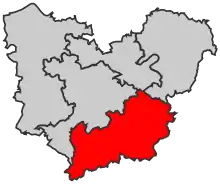 map of constituency in department | |
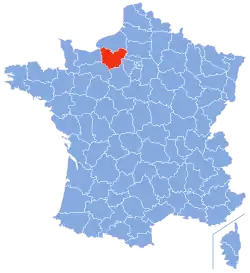 Location of Eure in France | |
| Deputy | |
| Department | Eure |
| Cantons | Breteuil, Damville, Evreux Est, Evreux Sud, Nonancourt, Pacy-sur-Eure, Saint-André-de-l'Eure, Verneuil-sur-Avre |
The 1st constituency of Eure is a French legislative constituency in Eure.
Historic representation
| Election | Member | Party | |
|---|---|---|---|
| 1958 | Jean de Broglie | CNIP | |
| 1962 | RI | ||
| 1967 | UDR | ||
| 1968 | |||
| 1973 | |||
| 1978 | Pierre Monfrais | UDF | |
| 1981 | Luc Tinseau | PS | |
| 1986 | Proportional representation - no election by constituency | ||
| 1988 | Jean-Louis Debré | RPR | |
| 1993 | |||
| 1995 | Françoise Charpentier[tablenote 1] | ||
| 1997 | Jean-Louis Debré | ||
| 2002 | UMP | ||
| 2007 | Françoise Charpentier[tablenote 2] | ||
| 2007 | Bruno Le Maire | ||
| 2009 | Guy Lefrand[tablenote 3] | ||
| 2012 | Bruno Le Maire | ||
| 2017 | LREM | ||
| 2017 | Séverine Gipson[tablenote 4] | ||
| 2022 | Christine Loir | RN | |
- ↑ Substitute for Jean-Louis Debré, appointed to government
- ↑ Substitute for Jean-Louis Debré, appointed to government
- ↑ Substitute for Bruno Le Maire, appointed to government
- ↑ Substitute for Bruno Le Maire, appointed Minister of the Economy and Finance
Election results
2022
| Party | Candidate | Votes | % | ±% | |||
|---|---|---|---|---|---|---|---|
| RN | Christine Loir | 11,830 | 29.89 | +7.80 | |||
| LREM (Ensemble) | Séverine Gipson | 10,583 | 26.74 | -17.72 | |||
| LFI (NUPÉS) | Christophe Ancelin | 7,609 | 19.22 | +1.46 | |||
| LR (UDC) | Christophe Alory | 3,219 | 8.13 | +1.97 | |||
| REC | Valérie Poirson | 1,736 | 4.39 | N/A | |||
| ECO | Véronique Allo | 1,479 | 3.74 | N/A | |||
| DVG | Anne Mansouret | 826 | 2.09 | N/A | |||
| Others | N/A | 2,298 | 5.81 | ||||
| Turnout | 39,580 | 46.64 | -1.35 | ||||
| 2nd round result | |||||||
| RN | Christine Loir | 18,629 | 50.77 | +15.30 | |||
| LREM (Ensemble) | Séverine Gipson | 18,062 | 49.23 | -15.30 | |||
| Turnout | 36,691 | 45.81 | +3.55 | ||||
| RN gain from LREM | |||||||
2017
| Candidate | Label | First round | Second round | |||
|---|---|---|---|---|---|---|
| Votes | % | Votes | % | |||
| Bruno Le Maire | REM | 17,967 | 44.46 | 21,398 | 64.53 | |
| Fabienne Delacour | FN | 8,927 | 22.09 | 11,761 | 35.47 | |
| Michaël Després | FI | 4,621 | 11.43 | |||
| Coumba Dioukhané | LR | 2,489 | 6.16 | |||
| Laëtitia Sanchez | ECO | 1,992 | 4.93 | |||
| Nicolas Miguet | DIV | 1,041 | 2.58 | |||
| Véronique Allo | ECO | 780 | 1.93 | |||
| Maryata Konté | PCF | 566 | 1.40 | |||
| Michaële Le Goff | DIV | 472 | 1.17 | |||
| Denis Panier | EXG | 440 | 1.09 | |||
| Fataumata Niakate | DLF | 405 | 1.00 | |||
| Remzi Sekerci | DIV | 291 | 0.72 | |||
| Frédérique Manley | DIV | 245 | 0.61 | |||
| Sid-Ali Ferrouk | DIV | 122 | 0.30 | |||
| Patricia Saint-Georges | DVG | 41 | 0.10 | |||
| Wilfried Paris | DIV | 14 | 0.03 | |||
| Minatou Graibis | DIV | 1 | 0.00 | |||
| Votes | 40,414 | 100.00 | 33,159 | 100.00 | ||
| Valid votes | 40,414 | 97.45 | 33,159 | 90.81 | ||
| Blank votes | 772 | 1.86 | 2,511 | 6.88 | ||
| Null votes | 286 | 0.69 | 844 | 2.31 | ||
| Turnout | 41,472 | 47.99 | 36,514 | 42.26 | ||
| Abstentions | 44,944 | 52.01 | 49,892 | 57.74 | ||
| Registered voters | 86,416 | 86,406 | ||||
| Source: Ministry of the Interior | ||||||
2012
| Candidate | Party | First round | Second round | ||||||||
|---|---|---|---|---|---|---|---|---|---|---|---|
| Votes | % | Votes | % | ||||||||
| Bruno Le Maire | UMP | 19,906 | 41.35% | 26,961 | 57.97% | ||||||
| Michel Champredon | PRG–PS | 15,164 | 31.50% | 19,544 | 42.03% | ||||||
| Nathalie Billard | FN | 7,921 | 16.45% | ||||||||
| Sandrine Cocagne | FG | 2,493 | 5.18% | ||||||||
| Driss Ettazaoui | MoDem | 1,058 | 2.20% | ||||||||
| Jérôme Delenda | UDN | 463 | 0.96% | ||||||||
| Corinne Roethlisberger | LO | 348 | 0.72% | ||||||||
| Jean-André Delabarre | NPA | 312 | 0.65% | ||||||||
| Jean Lemoine | CPNT | 285 | 0.59% | ||||||||
| Michel Vimard | BI | 190 | 0.39% | ||||||||
| Valid votes | 48,140 | 98.58% | 46,505 | 96.72% | |||||||
| Spoilt and null votes | 693 | 1.42% | 1,575 | 3.28% | |||||||
| Votes cast / turnout | 48,833 | 57.20% | 48,080 | 56.33% | |||||||
| Abstentions | 36,538 | 42.80% | 37,278 | 43.67% | |||||||
| Registered voters | 85,371 | 100.00% | 85,358 | 100.00% | |||||||
References
- ↑ "Résultats des élections législatives 2022 dans l'Eure". Le Monde.fr (in French). Retrieved 16 August 2022.
- ↑ "Résultats des élections législatives 2012". Ministry of the Interior. Retrieved 28 May 2017.
External links
This article is issued from Wikipedia. The text is licensed under Creative Commons - Attribution - Sharealike. Additional terms may apply for the media files.