Guadalupe y Calvo | |
|---|---|
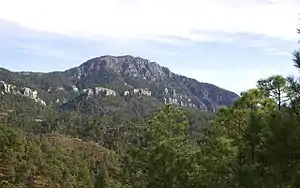 The Cerro Mohinora | |
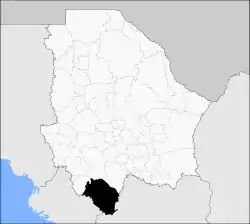 Municipality of Guadalupe y Calvo in Chihuahua | |
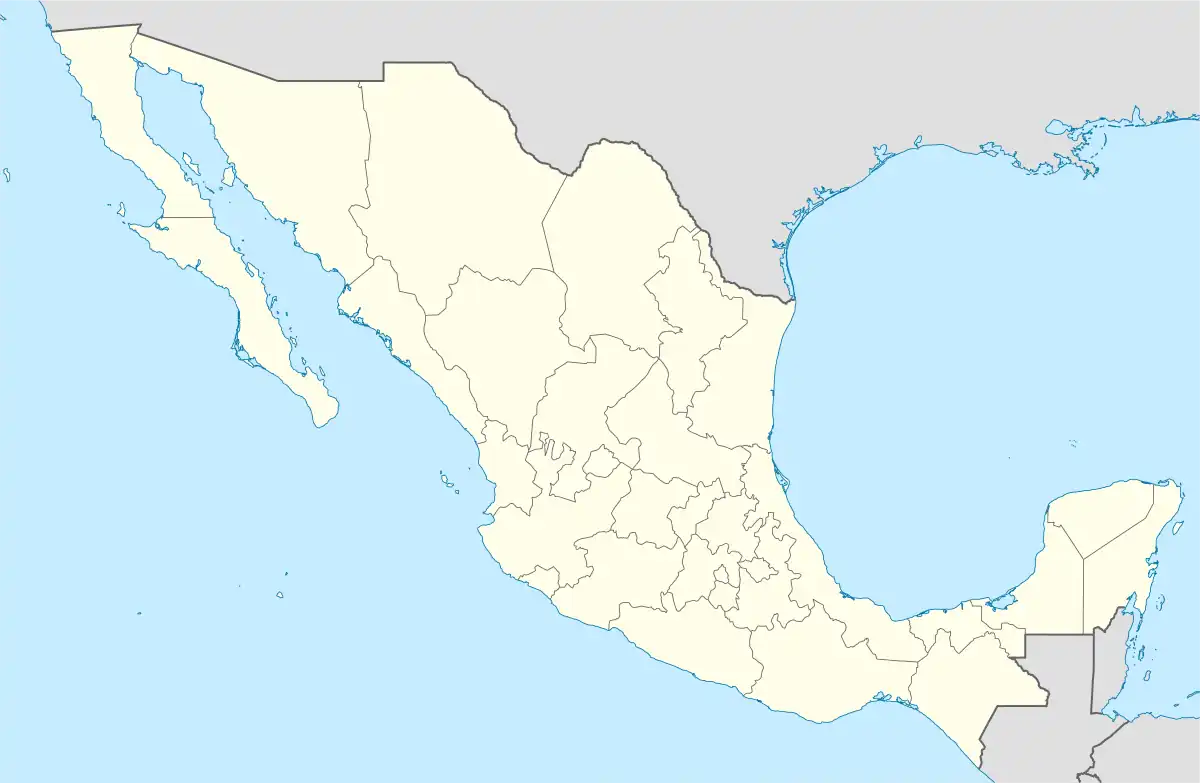 Guadalupe y Calvo Location in Mexico | |
| Coordinates: 26°5′42″N 106°57′52″W / 26.09500°N 106.96444°W | |
| Country | |
| State | Chihuahua |
| Municipal seat | Guadalupe y Calvo |
| Area | |
| • Total | 9,165.1 km2 (3,538.7 sq mi) |
| Population (2010) | |
| • Total | 53,499 |
Guadalupe y Calvo is one of the 67 municipalities of Chihuahua, in northern Mexico. The municipal seat lies at Guadalupe y Calvo. The municipality covers an area of 9,165.1 km².
As of 2010, the municipality had a total population of 53,499,[1] up from 51,854 as of 2005.[2]
As of 2010, the town of Guadalupe y Calvo had a population of 5,816.[1] Other than the town of Guadalupe y Calvo, the municipality had 1,416 localities, the largest of which (with 2010 populations in parentheses) were: Baborigame (3,294), classified as urban, and Atascaderos (1,559), Las Yerbitas (Aserradero) (1,200), and Turuachi (1,131), classified as rural.[1]
Geography
Towns and villages
The municipality has 1,086 localities. The largest are:
| Name | Population (2005) |
|---|---|
| Guadalupe y Calvo | 4,413 |
| Baborigame | 2,702 |
| Atascaderos | 1,384 |
| Las Yerbitas | 1,187 |
| Total Municipality | 51,854 |
| Month | Jan | Feb | Mar | Apr | May | Jun | Jul | Aug | Sep | Oct | Nov | Dec | Year |
|---|---|---|---|---|---|---|---|---|---|---|---|---|---|
| Record high °C (°F) | 26.0 (78.8) |
30.0 (86.0) |
34.0 (93.2) |
32.0 (89.6) |
34.0 (93.2) |
40.0 (104.0) |
37.0 (98.6) |
35.0 (95.0) |
33.0 (91.4) |
32.0 (89.6) |
38.0 (100.4) |
27.0 (80.6) |
40.0 (104.0) |
| Mean daily maximum °C (°F) | 16.8 (62.2) |
17.8 (64.0) |
20.1 (68.2) |
23.2 (73.8) |
25.9 (78.6) |
28.2 (82.8) |
25.4 (77.7) |
25.3 (77.5) |
25.1 (77.2) |
23.5 (74.3) |
20.8 (69.4) |
17.5 (63.5) |
22.5 (72.5) |
| Daily mean °C (°F) | 7.5 (45.5) |
8.0 (46.4) |
9.9 (49.8) |
12.9 (55.2) |
15.5 (59.9) |
18.6 (65.5) |
17.7 (63.9) |
17.6 (63.7) |
17.1 (62.8) |
14.3 (57.7) |
10.8 (51.4) |
8.4 (47.1) |
13.2 (55.8) |
| Mean daily minimum °C (°F) | −1.7 (28.9) |
−1.7 (28.9) |
−0.3 (31.5) |
2.6 (36.7) |
5.1 (41.2) |
8.9 (48.0) |
10.0 (50.0) |
9.9 (49.8) |
9.0 (48.2) |
5.2 (41.4) |
0.9 (33.6) |
−0.8 (30.6) |
3.9 (39.0) |
| Record low °C (°F) | −13.0 (8.6) |
−11.0 (12.2) |
−10.0 (14.0) |
−7.0 (19.4) |
−4.0 (24.8) |
1.0 (33.8) |
3.0 (37.4) |
4.0 (39.2) |
1.0 (33.8) |
−5.0 (23.0) |
−7.0 (19.4) |
−12.0 (10.4) |
−13.0 (8.6) |
| Average precipitation mm (inches) | 63.3 (2.49) |
46.5 (1.83) |
22.1 (0.87) |
20.4 (0.80) |
18.6 (0.73) |
103.5 (4.07) |
286.9 (11.30) |
249.1 (9.81) |
164.2 (6.46) |
58.6 (2.31) |
40.1 (1.58) |
84.9 (3.34) |
1,158.2 (45.60) |
| Average precipitation days (≥ 0.1 mm) | 4.6 | 3.7 | 1.8 | 2.2 | 2.7 | 11.5 | 25.8 | 24.1 | 16.3 | 5.9 | 3.1 | 5.4 | 107.1 |
| Source: Servicio Meteorológico National[3] | |||||||||||||
References
- 1 2 3 "Guadalupe y Calvo". Catálogo de Localidades. Secretaría de Desarrollo Social (SEDESOL). Retrieved 23 April 2014.
- ↑ "Guadelupe y Calvo". Enciclopedia de los Municipios de México. Instituto Nacional para el Federalismo y el Desarrollo Municipal. Archived from the original on January 24, 2012. Retrieved September 28, 2008.
- ↑ "NORMALES CLIMATOLÓGICAS 1951-2010". National Meteorological Service of Mexico. Retrieved December 8, 2012.
Chihuahua (capital) | ||
| Cities | 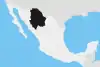 | |
| Municipalities | ||
| Metropolitan areas |
| |
| History | ||
| Sights | ||
| Other topics | ||
This article is issued from Wikipedia. The text is licensed under Creative Commons - Attribution - Sharealike. Additional terms may apply for the media files.