| 4th constituency of Loire | |
|---|---|
inline National Assembly of France | |
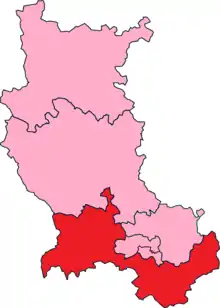 Loire's's 4th Constituency shown within Loire | |
| Deputy | |
| Department | Loire |
| Cantons | Bourg-Argental, Le Chambon-Feugerolles, Firminy, Pélussin, Saint-Genest-Malifaux, Saint-Bonnet-le-Château, Saint-Just-Saint-Rambert, Saint-Jean-Soleymieux |
| Registered voters | 101108[2] |
The 4th constituency of the Loire (French: Quatrième circonscription de la Loire) is a French legislative constituency in the Loire département. Like the other 576 French constituencies, it elects one MP using a two round electoral system.
Description
The 4th constituency of the Loire lies to the south of Saint-Etienne in the south of the department.
The seat has generally favoured candidates from the centre-right however in both 1988 and 1997 the voters opted for a Communist Party deputy. Since 2002 the seat has reliably conservative although incumbent Dino Cinieri held on by only 99 votes in 2017.
Assembly members
| Election | Member | Party | |
|---|---|---|---|
| 1988 | Théo Vial-Massat | PCF | |
| 1993 | Daniel Mandon | UDF | |
| 1997 | Bernard Outin | PCF | |
| 2002 | Dino Cinieri | UMP | |
| 2007 | |||
| 2012 | |||
| 2017 | LR | ||
| 2022 | |||
Election results
2022
| Party | Candidate | Votes | % | ±% | |||
|---|---|---|---|---|---|---|---|
| LR (UDC) | Dino Cinieri | 12,601 | 25.81 | +2.90 | |||
| LFI (NUPÉS) | Bernard Paemelaere | 11,501 | 23.56 | +0.40 | |||
| RN | Anthony Gibert | 10,555 | 21.62 | +7.53 | |||
| LREM (Ensemble) | Shannon Seban | 8,224 | 16.84 | -13.60 | |||
| REC | Jean-Baptiste Rouquerol | 1,930 | 3.95 | N/A | |||
| ECO | Pascal Thomas | 1,177 | 2.41 | +2.41 | |||
| PRG | Sana Belmouden | 975 | 2.00 | N/A | |||
| Others | N/A | 1,863 | - | - | |||
| Turnout | 48,826 | 47.80 | -1.30 | ||||
| 2nd round result | |||||||
| LR (UDC) | Dino Cinieri | 27,847 | 61.61 | +11.48 | |||
| LFI (NUPÉS) | Bernard Paemelaere | 17,352 | 38.39 | N/A | |||
| Turnout | 45,199 | 46.06 | +4.09 | ||||
| LR hold | |||||||
2017
| Candidate | Label | First round | Second round | |||
|---|---|---|---|---|---|---|
| Votes | % | Votes | % | |||
| David Kauffer | REM | 14,880 | 30.44 | 18,940 | 49.87 | |
| Dino Cinieri | LR | 11,199 | 22.91 | 19,039 | 50.13 | |
| Raphaëlle Jeanson | FN | 7,835 | 16.03 | |||
| Léo Chavas | FI | 5,206 | 10.65 | |||
| Christophe Faverjon | PCF | 5,108 | 10.45 | |||
| Olivier Joly | DVD | 2,431 | 4.97 | |||
| Gérard Guillaumin | ECO | 1,005 | 2.06 | |||
| Patrick Mignon | DLF | 638 | 1.31 | |||
| Françoise Leclet | EXG | 386 | 0.79 | |||
| Jean-Christophe Debens | DIV | 193 | 0.39 | |||
| Pascal Thomas | ECO | 0 | 0.00 | |||
| François Shematsi | EXD | 0 | 0.00 | |||
| Votes | 48,881 | 100.00 | 37,979 | 100.00 | ||
| Valid votes | 48,881 | 98.47 | 37,979 | 89.51 | ||
| Blank votes | 556 | 1.12 | 3,306 | 7.79 | ||
| Null votes | 203 | 0.41 | 1,145 | 2.70 | ||
| Turnout | 49,640 | 49.10 | 42,430 | 41.97 | ||
| Abstentions | 51,460 | 50.90 | 58,678 | 58.03 | ||
| Registered voters | 101,100 | 101,108 | ||||
| Source: Ministry of the Interior[3] | ||||||
2012
| Candidate | Party | First round | Second round | ||||||||
|---|---|---|---|---|---|---|---|---|---|---|---|
| Votes | % | Votes | % | ||||||||
| Dino Cinieri | UMP | 19,227 | 33.08% | 24,528 | 41.96% | ||||||
| Léla Bencharif | EELV | 12,979 | 22.33% | 23,195 | 39.68% | ||||||
| Robert Heyraud | FN | 12,405 | 21.35% | 10,731 | 18.36% | ||||||
| Christophe Faverjon | FG | 9,982 | 17.18% | ||||||||
| Jean-Claude Reymond | PRG | 1,566 | 2.69% | ||||||||
| Jacques Berlioz | DLR | 1,001 | 1.72% | ||||||||
| Odile Cote | LO | 430 | 0.74% | ||||||||
| Pascal-Simon Thomas-Bonnard | AEI | 406 | 0.70% | ||||||||
| Thierry Peyron | 117 | 0.20% | |||||||||
| Michèle Perez | MoDem dissident | 2 | 0.00% | ||||||||
| Valid votes | 58,115 | 98.56% | 58,454 | 98.18% | |||||||
| Spoilt and null votes | 847 | 1.44% | 1,081 | 1.82% | |||||||
| Votes cast / turnout | 58,962 | 59.48% | 59,535 | 60.07% | |||||||
| Abstentions | 40,161 | 40.52% | 39,574 | 39.93% | |||||||
| Registered voters | 99,123 | 100.00% | 99,109 | 100.00% | |||||||
References
- 1 2 "577 Députés – Assemblée nationale". www2.assemblee-nationale.fr.
- ↑ "Les résultats aux élections législatives de 2017 – Assemblée nationale". www2.assemblee-nationale.fr.
- ↑ "Résultats des élections législatives 2017" [Results of 2017 Legislative Election] (in French). Ministry of the Interior.
- ↑ "Résultats des élections législatives 2012" [Results of 2012 Legislative Election] (in French). Ministry of the Interior.
This article is issued from Wikipedia. The text is licensed under Creative Commons - Attribution - Sharealike. Additional terms may apply for the media files.