| ||||||||||||||||||||||||||||
All 65 seats in the House of Representatives 33 seats needed for a majority | ||||||||||||||||||||||||||||
|---|---|---|---|---|---|---|---|---|---|---|---|---|---|---|---|---|---|---|---|---|---|---|---|---|---|---|---|---|
| ||||||||||||||||||||||||||||
 | ||||||||||||||||||||||||||||
.jpg.webp)

 |
|---|

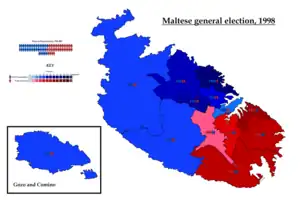
General elections were held in Malta on 5 September 1998.[1] The result was a victory for the Nationalist Party, which won 35 of the 65 seats.
Results
 | |||||
|---|---|---|---|---|---|
| Party | Votes | % | Seats | +/– | |
| Nationalist Party | 137,037 | 51.81 | 35 | +1 | |
| Malta Labour Party | 124,220 | 46.97 | 30 | –5 | |
| Democratic Alternative | 3,209 | 1.21 | 0 | 0 | |
| Independents | 27 | 0.01 | 0 | 0 | |
| Total | 264,493 | 100.00 | 65 | –4 | |
| Valid votes | 264,493 | 98.63 | |||
| Invalid/blank votes | 3,667 | 1.37 | |||
| Total votes | 268,160 | 100.00 | |||
| Registered voters/turnout | 281,078 | 95.40 | |||
| Source: Nohlen & Stöver | |||||
References
- ↑ Dieter Nohlen & Philip Stöver (2010) Elections in Europe: A data handbook, p1302 ISBN 978-3-8329-5609-7
This article is issued from Wikipedia. The text is licensed under Creative Commons - Attribution - Sharealike. Additional terms may apply for the media files.