Ponta Delgada | |
|---|---|
 | |
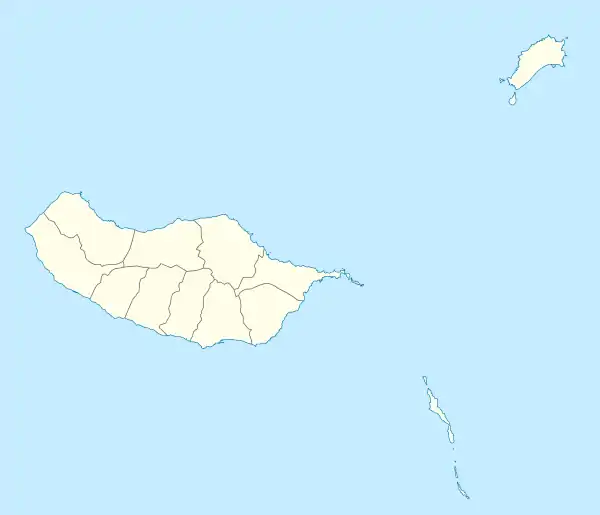 Ponta Delgada Location in Madeira | |
| Coordinates: 32°49′30″N 16°59′20″W / 32.825°N 16.989°W | |
| Country | |
| Auton. region | Madeira |
| Municipality | São Vicente |
| Area | |
| • Total | 9.39 km2 (3.63 sq mi) |
| Population (2011) | |
| • Total | 1,363 |
| • Density | 150/km2 (380/sq mi) |
| Time zone | UTC±00:00 (WET) |
| • Summer (DST) | UTC+01:00 (WEST) |
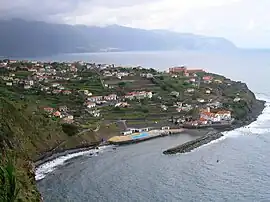
Ponta Delgada is a parish in the municipality of São Vicente on the island of Madeira. The population in 2011 was 1,363,[1] in an area of 9.39 km2.[2] Ponta Delgada is located on the north coast, 2 km west of Boa Ventura and 6 km east of São Vicente.
Climate
| Climate data for Ponta Delgada, 1951-1980 | |||||||||||||
|---|---|---|---|---|---|---|---|---|---|---|---|---|---|
| Month | Jan | Feb | Mar | Apr | May | Jun | Jul | Aug | Sep | Oct | Nov | Dec | Year |
| Record high °C (°F) | 26.9 (80.4) |
27.3 (81.1) |
30.5 (86.9) |
25.5 (77.9) |
30.0 (86.0) |
27.4 (81.3) |
30.1 (86.2) |
31.3 (88.3) |
33.5 (92.3) |
33.4 (92.1) |
28.2 (82.8) |
27.6 (81.7) |
33.5 (92.3) |
| Mean daily maximum °C (°F) | 17.8 (64.0) |
17.9 (64.2) |
18.6 (65.5) |
18.9 (66.0) |
20.5 (68.9) |
22.1 (71.8) |
23.1 (73.6) |
24.6 (76.3) |
24.5 (76.1) |
22.7 (72.9) |
20.1 (68.2) |
18.0 (64.4) |
20.7 (69.3) |
| Daily mean °C (°F) | 15.2 (59.4) |
15.2 (59.4) |
15.6 (60.1) |
15.9 (60.6) |
17.3 (63.1) |
19.0 (66.2) |
20.2 (68.4) |
21.4 (70.5) |
21.2 (70.2) |
19.8 (67.6) |
17.5 (63.5) |
15.8 (60.4) |
17.8 (64.1) |
| Mean daily minimum °C (°F) | 12.6 (54.7) |
12.4 (54.3) |
12.6 (54.7) |
12.9 (55.2) |
14.1 (57.4) |
15.9 (60.6) |
17.4 (63.3) |
18.2 (64.8) |
17.9 (64.2) |
16.8 (62.2) |
14.9 (58.8) |
13.6 (56.5) |
14.9 (58.9) |
| Record low °C (°F) | 7.6 (45.7) |
9.3 (48.7) |
8.3 (46.9) |
8.7 (47.7) |
10.3 (50.5) |
12.2 (54.0) |
13.6 (56.5) |
12.1 (53.8) |
14.2 (57.6) |
12.0 (53.6) |
10.8 (51.4) |
8.0 (46.4) |
7.6 (45.7) |
| Average precipitation mm (inches) | 191.0 (7.52) |
140.0 (5.51) |
117.0 (4.61) |
68.3 (2.69) |
45.8 (1.80) |
34.8 (1.37) |
15.6 (0.61) |
25.3 (1.00) |
51.5 (2.03) |
156.0 (6.14) |
180.0 (7.09) |
143.0 (5.63) |
1,168.3 (46) |
| Average relative humidity (%) | 78 | 77 | 76 | 76 | 78 | 78 | 77 | 78 | 80 | 80 | 79 | 77 | 78 |
| Source: IPMA[3][4] | |||||||||||||
References
- ↑ Instituto Nacional de Estatística
- ↑ Eurostat
- ↑ "Proposta de alteração do PDM de São Vicente" (PDF). São Vicente Municipality. Retrieved 19 August 2021.
- ↑ "Sistema Biofísico" (PDF). cm-saovicente.pt. Retrieved 1 December 2020.
This article is issued from Wikipedia. The text is licensed under Creative Commons - Attribution - Sharealike. Additional terms may apply for the media files.