 |
|---|
| Administrative divisions (parishes) |
General elections were held in Dominica on 1 July 1985.[1] The result was a victory for the Dominica Freedom Party, which won 15 of the 21 seats. Voter turnout was 74.6%.
Results
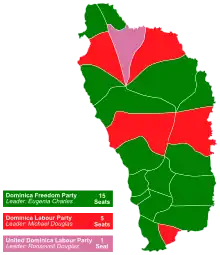
Results by constituency
| Party | Votes | % | Seats | +/– | |
|---|---|---|---|---|---|
| Dominica Freedom Party | 18,865 | 56.68 | 15 | –2 | |
| Dominica Labour Party | 13,014 | 39.10 | 5 | +5 | |
| United Dominica Labour Party | 558 | 1.68 | 1 | New | |
| Dominica Progressive Force | 78 | 0.23 | 0 | New | |
| Independents | 766 | 2.30 | 0 | –2 | |
| Total | 33,281 | 100.00 | 21 | 0 | |
| Valid votes | 33,281 | 99.15 | |||
| Invalid/blank votes | 284 | 0.85 | |||
| Total votes | 33,565 | 100.00 | |||
| Registered voters/turnout | 45,018 | 74.56 | |||
| Source: Nohlen | |||||
References
- ↑ Dieter Nohlen (2005) Elections in the Americas: A data handbook, Volume I, p230 ISBN 978-0-19-928357-6
This article is issued from Wikipedia. The text is licensed under Creative Commons - Attribution - Sharealike. Additional terms may apply for the media files.