| ||||||||||||||||||||||||||||||||||||||||||||||||||||||||
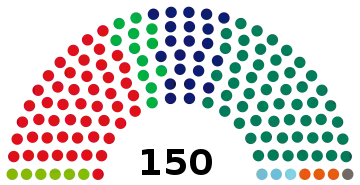
All 150 seats in the House of Representatives 76 seats needed for a majority | ||||||||||||||||||||||||||||||||||||||||||||||||||||||||
| Turnout | 80.3% ( | |||||||||||||||||||||||||||||||||||||||||||||||||||||||
|---|---|---|---|---|---|---|---|---|---|---|---|---|---|---|---|---|---|---|---|---|---|---|---|---|---|---|---|---|---|---|---|---|---|---|---|---|---|---|---|---|---|---|---|---|---|---|---|---|---|---|---|---|---|---|---|---|
This lists parties that won seats. See the complete results below.
| ||||||||||||||||||||||||||||||||||||||||||||||||||||||||
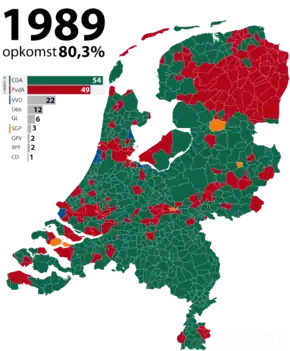
General elections were held in the Netherlands on 6 September 1989.[1] The Christian Democratic Appeal (CDA) remained the largest party, winning 54 of the 150 seats in the House of Representatives.[2] This chamber served for 4 years and 7 months, the longest tenure of any modern Dutch parliament.
Following the elections, the CDA formed a coalition government with the Labour Party with the CDA's Ruud Lubbers continuing as Prime Minister.
Results
 | |||||
|---|---|---|---|---|---|
| Party | Votes | % | Seats | +/– | |
| Christian Democratic Appeal | 3,135,056 | 35.32 | 54 | 0 | |
| Labour Party | 2,832,739 | 31.91 | 49 | –3 | |
| People's Party for Freedom and Democracy | 1,290,427 | 14.54 | 22 | –5 | |
| Democrats 66 | 700,538 | 7.89 | 12 | +3 | |
| GroenLinks | 361,324 | 4.07 | 6 | +3 | |
| Reformed Political Party | 165,918 | 1.87 | 3 | 0 | |
| Reformed Political League | 109,458 | 1.23 | 2 | +1 | |
| Reformatory Political Federation | 85,081 | 0.96 | 1 | 0 | |
| Centre Democrats | 81,337 | 0.92 | 1 | +1 | |
| Socialist Party | 38,829 | 0.44 | 0 | 0 | |
| The Greens | 30,698 | 0.35 | 0 | New | |
| Women's Party | 12,018 | 0.14 | 0 | New | |
| Elderly Central | 7,840 | 0.09 | 0 | New | |
| League of Communists in the Netherlands | 7,361 | 0.08 | 0 | 0 | |
| Realistic Netherlands | 6,032 | 0.07 | 0 | New | |
| Socialist Workers' Party | 4,283 | 0.05 | 0 | 0 | |
| Anti Unemployment Party | 2,166 | 0.02 | 0 | New | |
| Political Party for the Elderly | 2,149 | 0.02 | 0 | New | |
| Progressive Minorities Party | 1,939 | 0.02 | 0 | New | |
| Party of Democratic Socialists | 452 | 0.01 | 0 | New | |
| Socialist Minority Party | 328 | 0.00 | 0 | New | |
| Humanist Party | 318 | 0.00 | 0 | 0 | |
| Environmental Defence Party 2000+ | 138 | 0.00 | 0 | New | |
| Great Alliance Party | 54 | 0.00 | 0 | New | |
| Constitutional Federation | 31 | 0.00 | 0 | New | |
| Total | 8,876,514 | 100.00 | 150 | 0 | |
| Valid votes | 8,876,514 | 99.70 | |||
| Invalid/blank votes | 26,389 | 0.30 | |||
| Total votes | 8,902,903 | 100.00 | |||
| Registered voters/turnout | 11,091,070 | 80.27 | |||
| Source: Kiesraad | |||||
By province
| Province | CDA | PvdA | VVD | D66 | GL | SGP | GPV | RPF | CD | Others |
|---|---|---|---|---|---|---|---|---|---|---|
| 27.5 | 43.6 | 15.2 | 6.5 | 2.8 | 0.3 | 2.0 | 1.0 | 0.3 | 1.4 | |
| 28.6 | 31.4 | 17.6 | 9.2 | 4.0 | 2.6 | 2.1 | 2.0 | 1.4 | 1.1 | |
| 34.6 | 39.5 | 11.0 | 6.4 | 3.5 | 0.6 | 2.0 | 1.4 | 0.2 | 1.6 | |
| 38.3 | 30.6 | 13.4 | 7.0 | 3.7 | 2.3 | 1.0 | 1.4 | 0.4 | 1.9 | |
| 23.4 | 45.5 | 11.5 | 7.0 | 5.4 | 0.2 | 4.2 | 1.1 | 0.3 | 0.6 | |
| 46.9 | 33.4 | 9.0 | 5.4 | 3.0 | 0.1 | 0.2 | 0.1 | 0.5 | 1.9 | |
| 45.1 | 28.7 | 12.1 | 7.2 | 3.3 | 0.5 | 0.3 | 0.3 | 0.6 | 1.4 | |
| 28.1 | 32.3 | 18.9 | 9.9 | 6.2 | 0.4 | 0.6 | 0.6 | 1.4 | 1.9 | |
| 42.0 | 30.6 | 10.6 | 6.1 | 2.9 | 2.3 | 2.6 | 1.7 | 0.3 | 0.9 | |
| 30.4 | 31.1 | 16.9 | 9.1 | 3.9 | 3.3 | 1.1 | 1.1 | 1.7 | 1.4 | |
| 34.3 | 25.1 | 18.0 | 9.3 | 5.1 | 2.7 | 1.2 | 1.3 | 1.1 | 0.8 | |
| 33.9 | 29.6 | 14.1 | 6.7 | 2.8 | 8.3 | 1.7 | 1.6 | 0.7 | 0.8 |
References
- ↑ Dieter Nohlen & Philip Stöver (2010) Elections in Europe: A data handbook, p1396 ISBN 978-3-8329-5609-7
- ↑ Nohlen & Stöver, p1414
- ↑ "Tweede Kamer 6 september 1989". Kiesraad (in Dutch). Retrieved 4 November 2021.
| General |
|
|---|---|
| Provincial | |
| Municipal | |
| Water board | |
| Electoral college | |
| Island council | |
| European | |
| Referendums | |
| |
This article is issued from Wikipedia. The text is licensed under Creative Commons - Attribution - Sharealike. Additional terms may apply for the media files.