| ||||||||||||||||||||||||||||
All 70 seats to Croydon London Borough Council 36 seats needed for a majority | ||||||||||||||||||||||||||||
|---|---|---|---|---|---|---|---|---|---|---|---|---|---|---|---|---|---|---|---|---|---|---|---|---|---|---|---|---|
| ||||||||||||||||||||||||||||
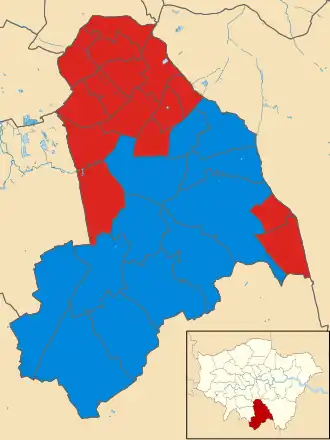 Map of the results of the 1994 Croydon Council election.Conservatives in blue and Labour in red. | ||||||||||||||||||||||||||||
| ||||||||||||||||||||||||||||
The 1994 Croydon Council election took place on 5 May 1994 to elect members of Croydon London Borough Council in London, England. The whole council was up for election and the Labour party gained overall control of the council.[1]
Jason Perry, who was elected as the first Mayor of Croydon in 2022, was elected to the council for the first time at this election in Coulsdon East.
Background
Election result
| Party | Seats | Gains | Losses | Net gain/loss | Seats % | Votes % | Votes | +/− | |
|---|---|---|---|---|---|---|---|---|---|
| Labour | 40 | 11 | 0 | 57.14 | 38.9 | ||||
| Conservative | 30 | 0 | 11 | 42.86 | 42.5 | ||||
| Liberal Democrats | 0 | 0 | 0 | 0 | 15.4 | ||||
| Independent | 0 | 0 | 0 | 0 | |||||
| 40 | 30 |
| Labour | Con |
Ward results
Addiscombe
| Party | Candidate | Votes | % | ±% | |
|---|---|---|---|---|---|
| Labour Co-op | Jeremy P. Fitzpatrick | 2,349 | |||
| Labour Co-op | Sean E. Fitzsimons | 2,136 | |||
| Labour Co-op | Bernadette Khan | 1,946 | |||
| Conservative | Martin W. Brown | 1,784 | |||
| Conservative | Hella P. H. El-Droubie | 1,572 | |||
| Conservative | Mohammad I. Khokhar | 1,382 | |||
| Liberal Democrats | Kay L. Schilich | 614 | |||
| Liberal Democrats | Patricia F. West | 609 | |||
| Green | Russell N. Heath | 543 | |||
| Independent | James P. Smyth | 237 | |||
| Majority | 162 | ||||
| Turnout | |||||
| Registered electors | |||||
| Labour Co-op hold | Swing | ||||
| Labour Co-op hold | Swing | ||||
| Labour Co-op gain from Conservative | Swing | ||||
Ashburton
| Party | Candidate | Votes | % | ±% | |
|---|---|---|---|---|---|
| Conservative | Edwin S. Arram | 1,367 | |||
| Conservative | Avril E. M. Slipper | 1,335 | |||
| Labour Co-op | Jean Walker | 1,225 | |||
| Labour Co-op | Martin D. Walker | 1,159 | |||
| Liberal Democrats | Paul F. West | 622 | |||
| Liberal Democrats | George W. Schlich | 612 | |||
| Majority | 110 | ||||
| Turnout | |||||
| Registered electors | |||||
| Conservative hold | Swing | ||||
| Conservative hold | Swing | ||||
Bensham Manor
| Party | Candidate | Votes | % | ±% | |
|---|---|---|---|---|---|
| Labour Co-op | Paul R. Mee | 2,650 | |||
| Labour Co-op | Alison J. Roberts | 2,621 | |||
| Labour Co-op | Helen S. Salmon | 2,519 | |||
| Conservative | Brendan T. Cullen | 1,317 | |||
| Conservative | Gloria J. Hutchens | 1,241 | |||
| Conservative | John L. Tooze | 1,185 | |||
| Majority | 1,202 | ||||
| Turnout | |||||
| Registered electors | |||||
| Labour Co-op hold | Swing | ||||
| Labour Co-op hold | Swing | ||||
| Labour Co-op hold | Swing | ||||
Beulah
| Party | Candidate | Votes | % | ±% | |
|---|---|---|---|---|---|
| Labour | Roy A. Grantham | 1,471 | |||
| Labour | Sherwan H. Chowdhury | 1,454 | |||
| Conservative | Michael D. Fisher | 1,365 | |||
| Conservative | Steven L. V. Hollands | 1,289 | |||
| Liberal Democrats | Jonathan R. Cope | 402 | |||
| Liberal Democrats | Christopher M. Pocock | 356 | |||
| Majority | 89 | ||||
| Turnout | |||||
| Registered electors | |||||
| Labour gain from Conservative | Swing | ||||
| Labour gain from Conservative | Swing | ||||
Broad Green
| Party | Candidate | Votes | % | ±% | |
|---|---|---|---|---|---|
| Labour | Stuart Collins | 2,230 | |||
| Labour | Rodney G. D. Matlock | 2,171 | |||
| Labour | Peter L. Spalding | 2,008 | |||
| Conservative | Eric S. Headlam | 832 | |||
| Conservative | Keith B. Pearson | 718 | |||
| Conservative | Donald S. Speakman | 693 | |||
| Majority | 1,176 | ||||
| Turnout | |||||
| Registered electors | |||||
| Labour hold | Swing | ||||
| Labour hold | Swing | ||||
| Labour hold | Swing | ||||
Coulsdon East
| Party | Candidate | Votes | % | ±% | |
|---|---|---|---|---|---|
| Conservative | Christopher Wright | 2,228 | |||
| Conservative | Christine A. Prentice | 2,105 | |||
| Conservative | Jason S. Perry | 2,091 | |||
| Liberal Democrats | Ian R. Atkins | 1,597 | |||
| Liberal Democrats | John P. Callen | 1,547 | |||
| Liberal Democrats | Keith C. Jacobs | 1,408 | |||
| Labour | Margaret Conway | 736 | |||
| Labour | Michael P. J. Phelan | 608 | |||
| Labour | Syed M. Hassan | 570 | |||
| Majority | 494 | ||||
| Turnout | |||||
| Registered electors | |||||
| Conservative hold | Swing | ||||
| Conservative hold | Swing | ||||
| Conservative hold | Swing | ||||
Croham
| Party | Candidate | Votes | % | ±% | |
|---|---|---|---|---|---|
| Conservative | Peter S. Bowness | 2,556 | |||
| Conservative | John P.B. Hecks | 2,533 | |||
| Conservative | Andrew D.W. Berry | 2,511 | |||
| Liberal Democrats | Michael T.A. Bishopp | 1,330 | |||
| Liberal Democrats | Christopher G. Peacock | 1,294 | |||
| Liberal Democrats | Malcolm Saunders | 1,249 | |||
| Labour | Maria T. Dennis | 985 | |||
| Labour | Barry P. Buttigieg | 955 | |||
| Labour | Jeffrey R. Primm | 898 | |||
| Peoples Choice | Mark R.L. Samuel | 122 | |||
| Majority | 1,181 | ||||
| Turnout | 5,055 | 50.6 | |||
| Registered electors | 9,994 | ||||
| Conservative hold | Swing | ||||
| Conservative hold | Swing | ||||
| Conservative hold | Swing | ||||
Fairfield
| Party | Candidate | Votes | % | ±% | |
|---|---|---|---|---|---|
| Conservative | Richard J. Billington | 2,505 | |||
| Conservative | Robert W. Coatman | 2,465 | |||
| Conservative | Michael D. Wunn | 2,359 | |||
| Labour | Alexander J. M. Burridge | 1,517 | |||
| Labour | Robert J. Newman | 1,479 | |||
| Labour | Richard B. Young | 1,434 | |||
| Liberal Democrats | Philip H. Barron | 809 | |||
| Liberal Democrats | Michael G. Gill | 757 | |||
| Liberal Democrats | Christine T. Hardisty | 739 | |||
| Chocolate Fudge Cake Party | John S. Cartwright | 175 | |||
| The People's Choice | Deborah L. Edmonds | 108 | |||
| Majority | 842 | ||||
| Turnout | |||||
| Registered electors | |||||
| Conservative hold | Swing | ||||
| Conservative hold | Swing | ||||
| Conservative hold | Swing | ||||
Fieldway
| Party | Candidate | Votes | % | ±% | |
|---|---|---|---|---|---|
| Labour Co-op | James L. Walker | 1,508 | |||
| Labour Co-op | Mary M. Walker | 1,411 | |||
| Conservative | John R. Miller | 486 | |||
| Conservative | Dinah M. Matthews | 433 | |||
| Majority | 925 | ||||
| Turnout | |||||
| Registered electors | |||||
| Labour Co-op hold | Swing | ||||
| Labour Co-op hold | Swing | ||||
Heathfield
| Party | Candidate | Votes | % | ±% | |
|---|---|---|---|---|---|
| Conservative | Margaret V. Mead | 2,260 | |||
| Conservative | Mary M. H. Horden | 2,251 | |||
| Conservative | Andrew J. Pelling | 2,199 | |||
| Labour | Mark Chapman | 1,188 | |||
| Labour | Alan Buckfield | 1,083 | |||
| Labour | David T. Petherbridge | 946 | |||
| Liberal Democrats | David A. Holmes | 774 | |||
| Liberal Democrats | Leo C. E. Held | 711 | |||
| Liberal Democrats | Peter S. Ladanyi | 667 | |||
| Independent | Michael T. Murphy | 242 | |||
| Majority | 1,011 | ||||
| Turnout | |||||
| Registered electors | |||||
| Conservative hold | Swing | ||||
| Conservative hold | Swing | ||||
| Conservative hold | Swing | ||||
Kenley
| Party | Candidate | Votes | % | ±% | |
|---|---|---|---|---|---|
| Conservative | Alan K. Carey | 1,631 | |||
| Conservative | Brian G. Smith | 1,480 | |||
| Liberal Democrats | Gordon E. Burnett | 787 | |||
| Liberal Democrats | James M. T. Kirkwood | 772 | |||
| Labour | William E. J. Richardson | 492 | |||
| Labour | David P. Price | 450 | |||
| Majority | 693 | ||||
| Turnout | |||||
| Registered electors | |||||
| Conservative hold | Swing | ||||
| Conservative hold | Swing | ||||
Monks Orchard
| Party | Candidate | Votes | % | ±% | |
|---|---|---|---|---|---|
| Conservative | Derek R. Loughborough | 2,326 | |||
| Conservative | Peter J. Campbell | 2,308 | |||
| Labour | David L. Davies | 900 | |||
| Labour | Lynette E. Murray | 792 | |||
| Liberal Democrats | David G. Gosling | 739 | |||
| Liberal Democrats | Leslie Price | 666 | |||
| Majority | 1,642 | ||||
| Turnout | |||||
| Registered electors | |||||
| Conservative hold | Swing | ||||
| Conservative hold | Swing | ||||
New Addington
| Party | Candidate | Votes | % | ±% | |
|---|---|---|---|---|---|
| Labour | Geraint R. Davies | 2,150 | |||
| Labour | Trevor J. Laffin | 2,012 | |||
| Labour | Valerie Shawcross | 1,912 | |||
| Conservative | William J. Eastoe | 906 | |||
| Conservative | Roy T. Miller | 843 | |||
| Conservative | Paul McCombie | 794 | |||
| Majority | 1,006 | ||||
| Turnout | |||||
| Registered electors | |||||
| Labour hold | Swing | ||||
| Labour hold | Swing | ||||
| Labour hold | Swing | ||||
Norbury
| Party | Candidate | Votes | % | ±% | |
|---|---|---|---|---|---|
| Labour | Peter W. Hopson | 2,082 | |||
| Labour | Margaret R. Mansell | 2,074 | |||
| Labour | Shafiqul I. Khan | 2,039 | |||
| Conservative | Geoffrey Geraghty | 1,967 | |||
| Conservative | Colin Johnston | 1,940 | |||
| Conservative | Bryan J. Kendall | 1,934 | |||
| Liberal Democrats | Pamela E. Freeman | 609 | |||
| Liberal Democrats | Geoffrey Morley | 426 | |||
| Liberal Democrats | Beryl R. Pocock | 422 | |||
| Majority | 72 | ||||
| Turnout | |||||
| Registered electors | |||||
| Labour gain from Conservative | Swing | ||||
| Labour gain from Conservative | Swing | ||||
| Labour gain from Conservative | Swing | ||||
Purley
| Party | Candidate | Votes | % | ±% | |
|---|---|---|---|---|---|
| Conservative | Graham J. Bass | 2,428 | |||
| Conservative | Peter J. F. Macdonald | 2,410 | |||
| Conservative | Derek G. Millard | 2,347 | |||
| Liberal Democrats | Jenefer G. A. Riley | 1,512 | |||
| Liberal Democrats | Pamela A. Randall | 1,473 | |||
| Liberal Democrats | Sarah J. Newton | 1,431 | |||
| Labour | Michael G. Ryan | 811 | |||
| Labour | Richard M. Plackett | 803 | |||
| Labour | Paul A. Ryan | 707 | |||
| Green | Shirley R. L. Ings | 236 | |||
| Green | Bruce J. Horner | 221 | |||
| Majority | 835 | ||||
| Turnout | |||||
| Registered electors | |||||
| Conservative hold | Swing | ||||
| Conservative hold | Swing | ||||
| Conservative hold | Swing | ||||
Rylands
| Party | Candidate | Votes | % | ±% | |
|---|---|---|---|---|---|
| Labour | Mark Hourston | 1,693 | |||
| Labour | Karen A. Jewitt | 1,625 | |||
| Conservative | James N. W. Bullen | 1,068 | |||
| Conservative | Owen W. Thompson | 961 | |||
| Majority | 557 | ||||
| Turnout | |||||
| Registered electors | |||||
| Labour hold | Swing | ||||
| Labour hold | Swing | ||||
Sanderstead
| Party | Candidate | Votes | % | ±% | |
|---|---|---|---|---|---|
| Conservative | Bruce T. H. Marshall | 2,083 | |||
| Conservative | Graham T. W. Speed | 2,024 | |||
| Liberal Democrats | Gavin T. Howard-Jones | 1,104 | |||
| Liberal Democrats | Barry D. Stocker | 909 | |||
| Labour | Roger D. Wicks | 636 | |||
| Labour | Jean-Paul Irtelli | 634 | |||
| The People's Choice | Neville Sprague | 125 | |||
| Majority | 920 | ||||
| Turnout | |||||
| Registered electors | |||||
| Conservative hold | Swing | ||||
| Conservative hold | Swing | ||||
Selsdon
| Party | Candidate | Votes | % | ±% | |
|---|---|---|---|---|---|
| Conservative | Richard H. R. Adamson | 2,060 | |||
| Conservative | Dudley S. Mead | 1,973 | |||
| Liberal Democrats | Keith Shuttleworth | 1,475 | |||
| Liberal Democrats | Edna G. Wickham | 1,341 | |||
| Labour | William L. Brown | 509 | |||
| Labour | Linda N. Nazarko | 449 | |||
| Independent | Alan E. Sales | 87 | |||
| Majority | 498 | ||||
| Turnout | |||||
| Registered electors | |||||
| Conservative hold | Swing | ||||
| Conservative hold | Swing | ||||
South Norwood
| Party | Candidate | Votes | % | ±% | |
|---|---|---|---|---|---|
| Labour | Clive B. Fraser | 1,991 | |||
| Labour | Jenny Bushell | 1,935 | |||
| Labour | Michael Jewitt | 1,927 | |||
| Conservative | David Lipman | 1,563 | |||
| Conservative | Eric J. Kings | 1,456 | |||
| Conservative | Pauline Miles | 1,408 | |||
| Liberal Democrats | Philip J. Brown | 467 | |||
| Liberal Democrats | Jan Perry | 446 | |||
| Liberal Democrats | Julie Hardy-McBride | 443 | |||
| Majority | 364 | ||||
| Turnout | |||||
| Registered electors | |||||
| Labour gain from Conservative | Swing | ||||
| Labour gain from Conservative | Swing | ||||
| Labour gain from Conservative | Swing | ||||
Spring Park
| Party | Candidate | Votes | % | ±% | |
|---|---|---|---|---|---|
| Conservative | Janet A. Marshall | 2,396 | |||
| Conservative | Denis E. Perry | 2,302 | |||
| Labour | Vanessa C. Fry | 1,228 | |||
| Labour | Stephen C. Moyse | 1,129 | |||
| Green | Andrew P. Bebington | 555 | |||
| Majority | 1,074 | ||||
| Turnout | |||||
| Registered electors | |||||
| Conservative hold | Swing | ||||
| Conservative hold | Swing | ||||
Thornton Heath
| Party | Candidate | Votes | % | ±% | |
|---|---|---|---|---|---|
| Labour | Adrian S. Dennis | 2,363 | |||
| Labour | Wallace W. Garratt | 2,274 | |||
| Labour | Raj Chandarana | 2,182 | |||
| Conservative | Robert G. Oliver | 1,175 | |||
| Conservative | Bernard K. Ampaw | 1,078 | |||
| Majority | 1,007 | ||||
| Turnout | |||||
| Registered electors | |||||
| Labour hold | Swing | ||||
| Labour hold | Swing | ||||
| Labour hold | Swing | ||||
Upper Norwood
| Party | Candidate | Votes | % | ±% | |
|---|---|---|---|---|---|
| Labour Co-op | Patrick T. Ryan | 1,696 | |||
| Labour Co-op | Ian G. Payne | 1,491 | |||
| Conservative | Margaret C. V. Parfitt | 1,396 | |||
| Conservative | David J. Macsweeney | 1,372 | |||
| Majority | 95 | ||||
| Turnout | |||||
| Registered electors | |||||
| Labour Co-op hold | Swing | ||||
| Labour Co-op gain from Conservative | Swing | ||||
Waddon
| Party | Candidate | Votes | % | ±% | |
|---|---|---|---|---|---|
| Labour | Christopher R. Allen | 2,094 | |||
| Labour | Marilyn K. Allen | 2,019 | |||
| Labour | Charles E. Burling | 1,888 | |||
| Conservative | Rex A.J. Calvert | 1,490 | |||
| Conservative | Bryan E. Coatman | 1,479 | |||
| Conservative | Mervyn R. Gatland | 1,375 | |||
| Liberal Democrats | Graham J. Axford | 792 | |||
| Liberal Democrats | Henry J. Norton | 759 | |||
| Liberal Democrats | Roger Barnett | 728 | |||
| Independent | Peter J. Collier | 449 | |||
| Majority | 398 | ||||
| Turnout | |||||
| Registered electors | |||||
| Labour hold | Swing | ||||
| Labour hold | Swing | ||||
| Labour hold | Swing | ||||
West Thornton
| Party | Candidate | Votes | % | ±% | |
|---|---|---|---|---|---|
| Labour | Elaine A. Gibbon | 2,354 | |||
| Labour | Clarence A. McKenzie | 2,284 | |||
| Labour | Gwendolyn E. Bernard | 2,230 | |||
| Conservative | Alan E. Aylmer | 1,152 | |||
| Conservative | Roger C. Taylor | 1,115 | |||
| Conservative | Eileen P. Seaborn | 1,075 | |||
| Liberal Democrats | Henry Russell | 564 | |||
| Majority | 1,078 | ||||
| Turnout | |||||
| Registered electors | |||||
| Labour hold | Swing | ||||
| Labour hold | Swing | ||||
| Labour hold | Swing | ||||
Whitehorse Manor
| Party | Candidate | Votes | % | ±% | |
|---|---|---|---|---|---|
| Labour | Peter J. Champion | 2,159 | |||
| Labour | Nuala O'Neill | 2,102 | |||
| Labour | Toni E. Letts | 2,042 | |||
| Conservative | Peter R. C. Davis | 865 | |||
| Conservative | Ian J. Parker | 803 | |||
| Conservative | Jill Thomas | 794 | |||
| Independent | Stanley H. Wells | 399 | |||
| Majority | 1,177 | ||||
| Turnout | |||||
| Registered electors | |||||
| Labour hold | Swing | ||||
| Labour hold | Swing | ||||
| Labour hold | Swing | ||||
Woodcote & Coulsdon West
| Party | Candidate | Votes | % | ±% | |
|---|---|---|---|---|---|
| Conservative | Maurice A. Folwer | 2,325 | |||
| Conservative | Anna Hawkins | 2,293 | |||
| Conservative | David J. Osland | 2,238 | |||
| Liberal Democrats | Margaret R. A. Billenness | 1,686 | |||
| Liberal Democrats | Trevor J. Austin | 1,612 | |||
| Liberal Democrats | Yvonne A. Jacobs | 1,561 | |||
| Labour | Ernest C. King | 709 | |||
| Labour | Ronald E. Rowland | 686 | |||
| Labour | Mohammad S. Hoda | 642 | |||
| Majority | 552 | ||||
| Turnout | |||||
| Registered electors | |||||
| Conservative hold | Swing | ||||
| Conservative hold | Swing | ||||
| Conservative hold | Swing | ||||
Woodside
| Party | Candidate | Votes | % | ±% | |
|---|---|---|---|---|---|
| Labour Co-op | Brian P. Finegan | 1,470 | |||
| Labour Co-op | Anthony J. Newman | 1,409 | |||
| Conservative | Derek W. Dorey | 967 | |||
| Conservative | Joanna L. M. W. Oliver | 924 | |||
| Liberal Democrats | Hilary J. Waterhouse | ||||
| Majority | 442 | ||||
| Turnout | |||||
| Registered electors | |||||
| Labour Co-op hold | Swing | ||||
| Labour Co-op hold | Swing | ||||
References
- ↑ "London Borough Council Elections 5 May 1994 including Results from the European Elections" (PDF). London Datastore. London Research Centre. Retrieved 29 March 2015.
| London boroughs |
|
|---|---|
| Metropolitan boroughs |
|
| District councils (England) |
|
| Regional councils (Scotland) | |
| Referendum | |
| |
This article is issued from Wikipedia. The text is licensed under Creative Commons - Attribution - Sharealike. Additional terms may apply for the media files.