| |||||||||||||||||||||||||||||||||||||||||||||||||||||||||||
16 of the 48 seats 25 seats needed for a majority | |||||||||||||||||||||||||||||||||||||||||||||||||||||||||||
|---|---|---|---|---|---|---|---|---|---|---|---|---|---|---|---|---|---|---|---|---|---|---|---|---|---|---|---|---|---|---|---|---|---|---|---|---|---|---|---|---|---|---|---|---|---|---|---|---|---|---|---|---|---|---|---|---|---|---|---|
| |||||||||||||||||||||||||||||||||||||||||||||||||||||||||||
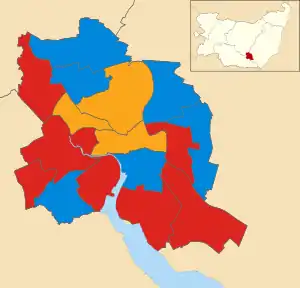 Map showing the 2007 local election results in Ipswich. | |||||||||||||||||||||||||||||||||||||||||||||||||||||||||||
| |||||||||||||||||||||||||||||||||||||||||||||||||||||||||||
Elections for Ipswich Borough Council were held on 3 May 2007. One third of the council was up for election and the council stayed under no overall control.
After the election, the composition of the council was:
- Conservative 20
- Labour 18
- Liberal Democrat 9
- Independent 1
Following the election the Conservatives and Liberal Democrats continued to form the executive of the council.[1]
Election result
| Party | Seats | Gains | Losses | Net gain/loss | Seats % | Votes % | Votes | +/− | |
|---|---|---|---|---|---|---|---|---|---|
| Labour | 7 | 1 | 1 | 0 | 43.8 | 39.7 | 12,349 | +3.7% | |
| Conservative | 6 | 0 | 0 | 0 | 37.5 | 35.6 | 11,067 | -0.1% | |
| Liberal Democrats | 3 | 1 | 1 | 0 | 18.8 | 20.8 | 6,470 | -4.7% | |
| Green | 0 | 0 | 0 | 0 | 0 | 2.7 | 851 | +0.5% | |
| Independent | 0 | 0 | 0 | 0 | 0 | 1.0 | 310 | +0.6% | |
| UKIP | 0 | 0 | 0 | 0 | 0 | 0.2 | 77 | +0.2% | |
Ward results
Alexandra
| Party | Candidate | Votes | % | ±% | |
|---|---|---|---|---|---|
| Liberal Democrats | Jane Chambers | 756 | 40.8 | +3.4 | |
| Labour | Albert Grant | 531 | 28.7 | -2.0 | |
| Conservative | Edward Phillips | 377 | 20.4 | -0.6 | |
| Green | John Taylor | 188 | 10.2 | -0.7 | |
| Majority | 225 | 12.1 | +5.4 | ||
| Turnout | 1,852 | 31.9 | -1.5 | ||
| Liberal Democrats hold | Swing | ||||
Bixley
| Party | Candidate | Votes | % | ±% | |
|---|---|---|---|---|---|
| Conservative | Gavin Maclure | 1,496 | 65.0 | +2.2 | |
| Labour | Barry Studd | 406 | 17.7 | +2.5 | |
| Liberal Democrats | Clive Witter | 398 | 17.3 | -4.7 | |
| Majority | 1,090 | 46.3 | +5.5 | ||
| Turnout | 2,300 | 39.8 | +0.6 | ||
| Conservative hold | Swing | ||||
Bridge
| Party | Candidate | Votes | % | ±% | |
|---|---|---|---|---|---|
| Labour | Philip Smart | 762 | 45.5 | -1.2 | |
| Conservative | Kevern Mulley | 585 | 35.0 | -0.7 | |
| Liberal Democrats | Christopher Newbury | 193 | 11.5 | -6.1 | |
| Green | Rick Deeks | 133 | 7.9 | +7.9 | |
| Majority | 177 | 10.5 | -0.5 | ||
| Turnout | 1,673 | 28.7 | -0.6 | ||
| Labour hold | Swing | ||||
Castle Hill
| Party | Candidate | Votes | % | ±% | |
|---|---|---|---|---|---|
| Conservative | David Goldsmith | 1,081 | 48.8 | -10.9 | |
| Liberal Democrats | Nigel Cheeseman | 502 | 22.7 | +1.5 | |
| Labour | John Harris | 425 | 19.2 | +0.1 | |
| Independent | Sally Wainman | 111 | 5.0 | +5.0 | |
| Green | Jason White | 96 | 4.3 | +4.3 | |
| Majority | 579 | 26.1 | -12.4 | ||
| Turnout | 2,215 | 37.4 | -2.3 | ||
| Conservative hold | Swing | ||||
Gainsborough
| Party | Candidate | Votes | % | ±% | |
|---|---|---|---|---|---|
| Labour | Don Edwards | 925 | 54.0 | +6.7 | |
| Conservative | Stephen Baldrey | 523 | 30.5 | -1.4 | |
| Liberal Democrats | Robin Whitmore | 264 | 15.4 | -0.5 | |
| Majority | 402 | 23.5 | +8.1 | ||
| Turnout | 1,712 | 27.9 | -1.0 | ||
| Labour hold | Swing | ||||
Gipping
| Party | Candidate | Votes | % | ±% | |
|---|---|---|---|---|---|
| Labour | Peter Gardiner | 824 | 52.3 | +7.2 | |
| Conservative | Maureen Springle | 477 | 30.3 | -4.2 | |
| Liberal Democrats | Les Nicholls | 274 | 17.4 | -3.1 | |
| Majority | 347 | 22.0 | +11.4 | ||
| Turnout | 1,575 | 27.3 | -0.6 | ||
| Labour hold | Swing | ||||
Holywells
| Party | Candidate | Votes | % | ±% | |
|---|---|---|---|---|---|
| Conservative | Liz Harsant | 851 | 50.8 | +3.5 | |
| Labour | Jamie McMahon | 518 | 30.9 | +8.8 | |
| Liberal Democrats | Kevin Walker | 305 | 18.2 | -12.4 | |
| Majority | 333 | 19.9 | +3.2 | ||
| Turnout | 1,674 | 33.5 | -1.0 | ||
| Conservative hold | Swing | ||||
Priory Heath
| Party | Candidate | Votes | % | ±% | |
|---|---|---|---|---|---|
| Labour | William Knowles | 852 | 45.4 | +5.5 | |
| Conservative | Tanya De Hoedt | 789 | 42.1 | +6.6 | |
| Liberal Democrats | Nick Jacob | 234 | 12.5 | -5.0 | |
| Majority | 63 | 3.3 | -1.1 | ||
| Turnout | 1,875 | 31.7 | +1.7 | ||
| Labour hold | Swing | ||||
Rushmere
| Party | Candidate | Votes | % | ±% | |
|---|---|---|---|---|---|
| Conservative | Eileen Smith | 1,014 | 43.1 | +2.5 | |
| Labour | Alasdair Ross | 905 | 38.5 | +5.2 | |
| Liberal Democrats | Cathy French | 269 | 11.4 | -14.7 | |
| Green | Brenda Cavanagh | 165 | 7.0 | +7.0 | |
| Majority | 109 | 4.6 | -2.7 | ||
| Turnout | 2,353 | 39.0 | -0.6 | ||
| Conservative hold | Swing | -1.35 | |||
Sprites
| Party | Candidate | Votes | % | ±% | |
|---|---|---|---|---|---|
| Labour | Roger Fern | 1,035 | 50.6 | +8.2 | |
| Conservative | Kathy Kenna | 840 | 41.1 | -5.6 | |
| Liberal Democrats | Oliver Holmes | 171 | 8.4 | -2.4 | |
| Majority | 195 | 9.5 | |||
| Turnout | 2,046 | 38.0 | +1.7 | ||
| Labour hold | Swing | ||||
St John's
| Party | Candidate | Votes | % | ±% | |
|---|---|---|---|---|---|
| Labour | Neil MacDonald | 1,004 | 44.0 | +4.8 | |
| Conservative | Pamela Kelly | 915 | 40.1 | +5.9 | |
| Liberal Democrats | Jill Atkins | 362 | 15.9 | -4.5 | |
| Majority | 89 | 3.9 | -1.1 | ||
| Turnout | 2,281 | 37.8 | -2.1 | ||
| Labour hold | Swing | ||||
St Margaret's
| Party | Candidate | Votes | % | ±% | |
|---|---|---|---|---|---|
| Liberal Democrats | John Cooper | 1,011 | 38.2 | -12.2 | |
| Conservative | Sophie Stanbrook | 968 | 36.5 | +3.7 | |
| Labour | Steve Buckingham | 289 | 10.9 | +1.0 | |
| Independent | Leonard Woolf | 199 | 7.5 | +7.5 | |
| Green | Amy Drayson | 183 | 6.9 | -0.1 | |
| Majority | 43 | 1.7 | -15.9 | ||
| Turnout | 2,650 | 44.6 | -2.8 | ||
| Liberal Democrats hold | Swing | ||||
Stoke Park
| Party | Candidate | Votes | % | ±% | |
|---|---|---|---|---|---|
| Conservative | Richard Pope | 871 | 52.0 | +4.4 | |
| Labour | Keith Rawlingson | 610 | 36.4 | -0.4 | |
| Liberal Democrats | Timothy Lockington | 194 | 11.6 | -4.0 | |
| Majority | 261 | 15.6 | +4.8 | ||
| Turnout | 1,675 | 30.2 | -1.3 | ||
| Conservative hold | Swing | ||||
Westgate
| Party | Candidate | Votes | % | ±% | |
|---|---|---|---|---|---|
| Liberal Democrats | Andrew Cann | 735 | 38.7 | +4.0 | |
| Labour | Martin Cook | 722 | 38.0 | +2.2 | |
| Conservative | Ian Fisher | 279 | 14.7 | -7.6 | |
| Green | Colin Rodgers | 86 | 4.5 | -2.8 | |
| UKIP | Russell Metcalfe | 77 | 4.1 | +4.1 | |
| Majority | 13 | 0.7 | |||
| Turnout | 1,899 | 30.8 | +0.4 | ||
| Liberal Democrats gain from Labour | Swing | ||||
Whitehouse
| Party | Candidate | Votes | % | ±% | |
|---|---|---|---|---|---|
| Labour | Anthony Lewis | 563 | 38.1 | +6.2 | |
| Liberal Democrats | Howard Stanley | 512 | 34.7 | -9.7 | |
| Conservative | Ben Matthews | 401 | 27.2 | +3.5 | |
| Majority | 51 | 3.4 | |||
| Turnout | 1,476 | 25.2 | -4.5 | ||
| Labour gain from Liberal Democrats | Swing | ||||
Whitton
| Party | Candidate | Votes | % | ±% | |
|---|---|---|---|---|---|
| Conservative | Michelle Bevan-Margetts | 882 | 47.2 | -5.0 | |
| Labour | Susan Crocker | 696 | 37.3 | +2.9 | |
| Liberal Democrats | Heidi Williams | 290 | 15.5 | +2.1 | |
| Majority | 186 | 9.9 | -7.9 | ||
| Turnout | 1,868 | 31.6 | -2.8 | ||
| Conservative hold | Swing | ||||
References
- 2007 Ipswich election result
- Full ward results Archived 27 September 2007 at the Wayback Machine
- Little change at Ipswich after vote
- ↑ "Labour frozen out of decision making". Archived from the original on 13 October 2007. Retrieved 29 July 2007.
| Suffolk County Council | |
|---|---|
| Babergh District Council | |
| East Suffolk District Council | |
| Ipswich Borough Council | |
| Mid Suffolk District Council | |
| West Suffolk District Council | |
| East Suffolk County Council |
|
| Forest Heath District Council | |
| St Edmundsbury Borough Council | |
| Suffolk Coastal District Council | |
| Waveney District Council | |
| West Suffolk County Council |
|
| |
This article is issued from Wikipedia. The text is licensed under Creative Commons - Attribution - Sharealike. Additional terms may apply for the media files.