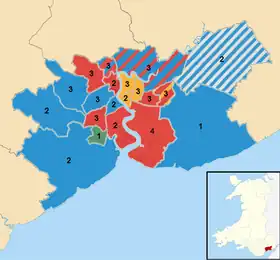
2008 election results map, showing numbers of councillors per ward and their party affiliations
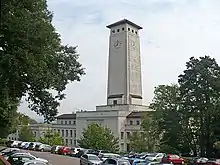
Newport Civic Centre
2008 elections to Newport City Council were held on 1 May 2008[1] along with elections to the other 21 local authorities in Wales, community council elections in Wales and 2008 United Kingdom local elections.
Councillors elected in this election serve a four-year term.
The previous election took place in 2004.
The next full election took place on 3 May 2012.
Election results: overview
| Party | Seats | Gains | Losses | Net gain/loss | Seats % | Votes % | Votes | +/− | |
|---|---|---|---|---|---|---|---|---|---|
| Labour | 22 | -9 | 44.0 | 33.3 | 13,884 | -2.9 | |||
| Conservative | 17 | +6 | 34.0 | 35.0 | 14,705 | +8.4 | |||
| Liberal Democrats | 9 | +3 | 18.0 | 21.8 | 9,066 | +0.6 | |||
| Plaid Cymru | 1 | 0 | 2.0 | 7.2 | 2,980 | -1.6 | |||
| Independent | 1 | 0 | 2.0 | 2.4 | 1,005 | +2.4 | |||
| Total | 50 | 41,640 | |||||||
- The Independent statistics are for all Independents, whether they are members of the Independent group on the council or not.
Ward results
Allt-yr-yn
| Party | Candidate | Votes | % | ±% | |
|---|---|---|---|---|---|
| Conservative | Matthew Evans | 1,818 | |||
| Conservative | David Fouweather | 1,800 | |||
| Conservative | Leslie Knight | 1,622 | |||
| Labour | Fabi Berrettoni | 722 | |||
| Liberal Democrats | Phil Bennett | 420 | |||
| Liberal Democrats | Megan Rees Webb | 411 | |||
| Liberal Democrats | Adrian Summers | 369 | |||
| Plaid Cymru | Mian Rashid | 324 | |||
| Majority | |||||
| Turnout | 7,486 | ||||
| Conservative hold | Swing | ||||
| Conservative hold | Swing | ||||
| Conservative hold | Swing | ||||
Alway
| Party | Candidate | Votes | % | ±% | |
|---|---|---|---|---|---|
| Labour | Raymond Truman | 795 | |||
| Labour | John Guy | 776 | |||
| Labour | Ken Powell | 775 | |||
| Conservative | Sarah Jones | 434 | |||
| Conservative | Sallie Mogford | 431 | |||
| Liberal Democrats | Anne Parry | 348 | |||
| Liberal Democrats | Terry Baulch | 344 | |||
| Liberal Democrats | Linda Davies | 309 | |||
| Plaid Cymru | Nagma Arshid | 251 | |||
| Majority | |||||
| Turnout | 4,463 | ||||
| Labour hold | Swing | ||||
| Labour hold | Swing | ||||
| Labour hold | Swing | ||||
Beechwood
| Party | Candidate | Votes | % | ±% | |
|---|---|---|---|---|---|
| Liberal Democrats | Hugh Clarke | 1,433 | |||
| Liberal Democrats | David Hando | 1,321 | |||
| Liberal Democrats | Jeff Evans | 1,288 | |||
| Labour | David Collins | 484 | |||
| Labour | Christopher Evans | 399 | |||
| Labour | Alan Jones | 373 | |||
| Conservative | David Hildred | 220 | |||
| Conservative | Kenneth Cornelious | 204 | |||
| Independent | Tony Lane | 202 | |||
| Conservative | Ruth Williams | 187 | |||
| Majority | |||||
| Turnout | 6,510 | ||||
| Liberal Democrats gain from | Swing | ||||
| Liberal Democrats gain from | Swing | ||||
| Liberal Democrats gain from | Swing | ||||
Bettws
| Party | Candidate | Votes | % | ±% | |
|---|---|---|---|---|---|
| Labour | Noel Trigg | 1,128 | |||
| Labour | Val Delahaye | 890 | |||
| Labour | Glyn Jarvis | 789 | |||
| Liberal Democrats | Susan Baker | 586 | |||
| Liberal Democrats | Ann Tripp | 451 | |||
| Liberal Democrats | David Gapper | 408 | |||
| Conservative | Michael Ryan | 331 | |||
| Conservative | Debbie Blackbird | 260 | |||
| Plaid Cymru | Firdaus Asghar | 75 | |||
| Independent | Vince Marenghi | 50 | |||
| Plaid Cymru | David Hall | 49 | |||
| Independent | Stephen Chomyn | 40 | |||
| Majority | |||||
| Turnout | 5,057 | ||||
| Labour hold | Swing | ||||
| Labour gain from | Swing | ||||
| Labour gain from | Swing | ||||
Caerleon
| Party | Candidate | Votes | % | ±% | |
|---|---|---|---|---|---|
| Conservative | Angela Jones | 1,324 | |||
| Conservative | Charles Ferris | 1,216 | |||
| Labour | Gail Giles | 1,181 | |||
| Conservative | Naomi Macey | 1,178 | |||
| Labour | Cliff Suller | 1,094 | |||
| Labour | Paul Huntley | 1,087 | |||
| Liberal Democrats | Theresa Hughes | 467 | |||
| Liberal Democrats | Peter Davies | 308 | |||
| Liberal Democrats | Pam Baulch | 306 | |||
| Majority | |||||
| Turnout | 8,161 | ||||
| Conservative gain from Labour | Swing | ||||
| Conservative hold | Swing | ||||
| Labour gain from | Swing | ||||
Gaer
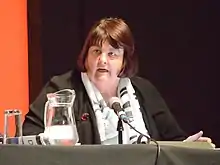
Debbie Wilcox, Newport City Council leader since 2016
| Party | Candidate | Votes | % | ±% | |
|---|---|---|---|---|---|
| Labour | Mark Whitcutt | 921 | |||
| Labour | Herbert Thomas | 883 | |||
| Labour | Deborah Wilcox | 847 | |||
| Conservative | Adam Wate | 813 | |||
| Conservative | Michael Wisniewski | 752 | |||
| Liberal Democrats | John Gibbon | 405 | |||
| Liberal Democrats | Michael Evans | 377 | |||
| Liberal Democrats | Mark Wheeldon | 333 | |||
| Plaid Cymru | Danielle Bennett | 258 | |||
| Majority | |||||
| Turnout | 5,589 | ||||
| Labour gain from | Swing | ||||
| Labour hold | Swing | ||||
| Labour gain from | Swing | ||||
Graig
| Party | Candidate | Votes | % | ±% | |
|---|---|---|---|---|---|
| Conservative | Margaret Cornelious | 1,187 | |||
| Conservative | David Williams | 1,070 | |||
| Labour | Andrew Sayer | 589 | |||
| Liberal Democrats | Sandra Flanagan | 317 | |||
| Liberal Democrats | Norman Mountain | 241 | |||
| Majority | |||||
| Turnout | 3,404 | ||||
| Conservative hold | Swing | ||||
| Conservative hold | Swing | ||||
Langstone
| Party | Candidate | Votes | % | ±% | |
|---|---|---|---|---|---|
| Conservative | David Atwell | 833 | |||
| Independent | Simon Lane | 753 | |||
| Conservative | Carole Atwell | 615 | |||
| Liberal Democrats | Ynys Edwards | 303 | |||
| Liberal Democrats | Linda Perry | 296 | |||
| Labour | Deborah Harvey | 138 | |||
| Plaid Cymru | Timothy Harvey | 114 | |||
| Majority | |||||
| Turnout | 3,052 | ||||
| Conservative hold | Swing | ||||
| Independent gain from Conservative | Swing | ||||
Liswerry
| Party | Candidate | Votes | % | ±% | |
|---|---|---|---|---|---|
| Labour | Ken Critchley | 1,018 | |||
| Labour | Allan Morris | 982 | |||
| Labour | John Richards | 879 | |||
| Labour | Andrew Jeavons | 972 | |||
| Conservative | Chris Blight | 728 | |||
| Conservative | Greg Waters | 683 | |||
| Conservative | John Ferrier | 644 | |||
| Liberal Democrats | Lisa Berry | 419 | |||
| Liberal Democrats | Martin Price | 328 | |||
| Liberal Democrats | Oliver Townsend | 326 | |||
| Liberal Democrats | Tomas Forsey | 270 | |||
| Majority | |||||
| Turnout | 7,249 | ||||
| Labour hold | Swing | ||||
| Labour gain from | Swing | ||||
| Labour gain from | Swing | ||||
| Labour gain from | Swing | ||||
Llanwern
| Party | Candidate | Votes | % | ±% | |
|---|---|---|---|---|---|
| Conservative | Martyn Kellaway | 491 | |||
| Labour | Ian Jones | 358 | |||
| Liberal Democrats | Stuart Bull | 92 | |||
| Majority | |||||
| Turnout | 941 | ||||
| Conservative hold | Swing | ||||
Malpas
| Party | Candidate | Votes | % | ±% | |
|---|---|---|---|---|---|
| Labour | Bill Langsford | 1,243 | |||
| Labour | David Mayer | 1,137 | |||
| Conservative | John Bird | 1,131 | |||
| Conservative | Ian Brown | 1,074 | |||
| Labour | Peter Davies | 1,064 | |||
| Conservative | Peter Meredith | 602 | |||
| Liberal Democrats | Susan Davies | 385 | |||
| Majority | |||||
| Turnout | 6,636 | ||||
| Labour gain from | Swing | ||||
| Labour hold | Swing | ||||
| Conservative hold | Swing | ||||
Marshfield
| Party | Candidate | Votes | % | ±% | |
|---|---|---|---|---|---|
| Conservative | Richard White | 974 | |||
| Conservative | Tom Suller | 952 | |||
| Labour | Neil Todd | 332 | |||
| Labour | Alan Speight | 283 | |||
| Liberal Democrats | Helena Wheeldon | 170 | |||
| Plaid Cymru | Susan Bennett | 162 | |||
| Liberal Democrats | Paul Bevan | 162 | |||
| Majority | |||||
| Turnout | 3,034 | ||||
| Conservative hold | Swing | ||||
| Conservative hold | Swing | ||||
Pillgwenlly
| Party | Candidate | Votes | % | ±% | |
|---|---|---|---|---|---|
| Labour | Ibrahim Hayat | 466 | |||
| Labour | Ron Jones | 464 | |||
| Conservative | Tony Ismail | 377 | |||
| Plaid Cymru | Khalilur Rahman | 375 | |||
| Plaid Cymru | Anthony Salkeld | 346 | |||
| Liberal Democrats | Jayne Lewis | 498 | |||
| Conservative | David Madden | 327 | |||
| Liberal Democrats | Sofique Miah | 278 | |||
| Majority | |||||
| Turnout | 2,964 | ||||
| Labour hold | Swing | ||||
| Labour hold | Swing | ||||
Ringland
| Party | Candidate | Votes | % | ±% | |
|---|---|---|---|---|---|
| Liberal Democrats | John Fortey | 939 | |||
| Labour | Bob Bright | 874 | |||
| Labour | Malcolm Linton | 871 | |||
| Liberal Democrats | Paul Jordan | 858 | |||
| Liberal Democrats | Patricia Harris | 841 | |||
| Labour | Tony Gray | 783 | |||
| Conservative | Tina Evans | 264 | |||
| Conservative | Jane Mazey | 225 | |||
| Plaid Cymru | Keith Bennett | 175 | |||
| Majority | |||||
| Turnout | 5,830 | ||||
| Liberal Democrats hold | Swing | ||||
| Labour gain from | Swing | ||||
| Labour hold | Swing | ||||
Rogerstone
| Party | Candidate | Votes | % | ±% | |
|---|---|---|---|---|---|
| Conservative | Valerie Dudley | 1,664 | |||
| Conservative | Stephen Jones | 1,576 | |||
| Conservative | Andrew Cooksey | 1,507 | |||
| Labour | Edward Burke | 1,450 | |||
| Labour | Jayne Bryant | 1,349 | |||
| Labour | Victoria Colley Wall | 1,136 | |||
| Liberal Democrats | Paul Angeli | 387 | |||
| Plaid Cymru | David Hall | 325 | |||
| Liberal Democrats | Jason Sullivan | 309 | |||
| Liberal Democrats | Maurice Bacon | 258 | |||
| Majority | |||||
| Turnout | 9,961 | ||||
| Conservative gain from Labour | Swing | ||||
| Conservative gain from Labour | Swing | ||||
| Conservative gain from | Swing | ||||
St Julians
| Party | Candidate | Votes | % | ±% | |
|---|---|---|---|---|---|
| Liberal Democrats | Ed Townsend | 1,148 | |||
| Liberal Democrats | Carmel Townsend | 1,029 | |||
| Liberal Democrats | Gill Ford | 985 | |||
| Conservative | Chris Blight | 581 | |||
| Conservative | Roy Lane | 552 | |||
| Conservative | Dale Hardman | 542 | |||
| Labour | Ken Goodger | 492 | |||
| Labour | Kenneth Chandler | 467 | |||
| Labour | Anthony Jermyn | 432 | |||
| Plaid Cymru | James Priest | 111 | |||
| Majority | |||||
| Turnout | 6,139 | ||||
| Liberal Democrats gain from | Swing | ||||
| Liberal Democrats gain from | Swing | ||||
| Liberal Democrats hold | Swing | ||||
Shaftesbury
| Party | Candidate | Votes | % | ±% | |
|---|---|---|---|---|---|
| Labour | Bob Poole | 478 | |||
| Labour | Paul Cockeram | 468 | |||
| Conservative | Mike Ryan | 429 | |||
| Conservative | James Hampson | 376 | |||
| Liberal Democrats | Julia Varley | 178 | |||
| Plaid Cymru | Jonathan Clark | 167 | |||
| Liberal Democrats | Bob Davies | 139 | |||
| Plaid Cymru | Omer Williams | 113 | |||
| Majority | |||||
| Turnout | 2,348 | ||||
| Labour hold | Swing | ||||
| Labour hold | Swing | ||||
Stow Hill
| Party | Candidate | Votes | % | ±% | |
|---|---|---|---|---|---|
| Conservative | Peter Davies | 723 | |||
| Conservative | William Routley | 616 | |||
| Labour | Miqdad al-Nuaimi | 436 | |||
| Labour | Fern Foster | 418 | |||
| Plaid Cymru | Rhys ab Elis | 91 | |||
| Liberal Democrats | Nigel Flanagan | 86 | |||
| Liberal Democrats | Winifred Lee | 72 | |||
| Plaid Cymru | Shereen Williams | 7 | |||
| Majority | |||||
| Turnout | 2,449 | ||||
| Conservative gain from | Swing | ||||
| Conservative gain from Labour | Swing | ||||
Tredegar Park
| Party | Candidate | Votes | % | ±% | |
|---|---|---|---|---|---|
| Plaid Cymru | James Brunnock | 364 | |||
| Labour | Trevor Watkins | 293 | |||
| Conservative | Gerry Coldham | 152 | |||
| Liberal Democrats | Andrew Bailey | 35 | |||
| Majority | 71 | N/A | |||
| Turnout | 844 | ||||
| Plaid Cymru gain from Labour | Swing | ||||
Victoria
| Party | Candidate | Votes | % | ±% | |
|---|---|---|---|---|---|
| Liberal Democrats | Mike Hamilton | 618 | |||
| Liberal Democrats | Mozadul Hussain | 604 | |||
| Labour | Chris Jenkins | 486 | |||
| Labour | Deb Davies | 450 | |||
| Plaid Cymru | Firdaus Asghar | 413 | |||
| Conservative | David Cox | 231 | |||
| Plaid Cymru | Trefor Puw | 197 | |||
| Majority | |||||
| Turnout | 2,999 | ||||
| Liberal Democrats gain from Plaid Cymru | Swing | ||||
| Liberal Democrats gain from Labour | Swing | ||||
References
- ↑ Local Election Results 2008 - National Assembly for Wales, Welsh Assembly, 2008
- ↑ Teale, Andrew. "Local Election Results 2008: Newport". Retrieved 1 May 2019.
Politics of Newport | |||||||
|---|---|---|---|---|---|---|---|
| MPs in the UK Parliament (2) |
| ||||||
| MSs in the Senedd (2) |
| ||||||
| Newport City Council (51) |
| ||||||
| Newport County Borough Council |
| ||||||
| Council wards | |||||||
| Communities | |||||||
| Metropolitan borough elections |
|
|---|---|
| Unitary authorities |
|
| District councils |
|
| Welsh councils |
|
| Mayoral elections | |
| Regional assembly elections | |
This article is issued from Wikipedia. The text is licensed under Creative Commons - Attribution - Sharealike. Additional terms may apply for the media files.