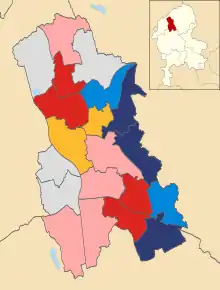
Results by ward.
The 2008 Stoke-on-Trent City Council election for the Stoke-on-Trent City Council took place on 1 May 2008. One third of the council was up for election.
Election result
| Party | Seats | Gains | Losses | Net gain/loss | Seats % | Votes % | Votes | +/− | |
|---|---|---|---|---|---|---|---|---|---|
| Labour | 4 | 2 | 12 | -10 | 25.1 | 14,038 | |||
| Conservative | 2 | 2 | 1 | +1 | 17.4 | 9,740 | |||
| Independent | 4 | 3 | 2 | +1 | 17.2 | 9,657 | |||
| BNP | 3 | 3 | 1 | +2 | 14.3 | 7,986 | |||
| City Independents | 5 | 5 | - | +5 | 12.8 | 7,186 | |||
| Liberal Democrats | 2 | 2 | 1 | +1 | 8.4 | 4,700 | |||
| Potteries Alliance | 0 | 4.3 | 2,387 | ||||||
| Green | 0 | 0.3 | 164 | ||||||
| Socialist Alternative | 0 | 0.2 | 130 | ||||||
| Turnout | 30.2 | 55,988 | |||||||
Ward results
| Party | Candidate | Votes | % | ±% | |
|---|---|---|---|---|---|
| BNP | Melanie Jane Baddeley | 858 | 31.0 | ||
| Labour | Gary Elsby | 784 | 28.3 | ||
| Conservative | Andrew John Wragg | 721 | 26.0 | ||
| Independent | Paul Sutton | 244 | 8.8 | ||
| Green | Barry Malpass | 164 | 5.9 | ||
| Majority | 74 | 2.7 | |||
| Turnout | 2,771 | 30.9 | |||
| BNP gain from Labour | Swing | ||||
| Party | Candidate | Votes | % | ±% | |
|---|---|---|---|---|---|
| BNP | Steven Reginald Batkin | 829 | 34.6 | ||
| Labour | Mervin Thomas Smith | 620 | 25.9 | ||
| Independent | Wendy Caroline Johnson | 320 | 13.4 | ||
| Conservative | Christine Warren | 273 | 11.4 | ||
| Potteries Alliance | Maurice Lewis | 177 | 7.4 | ||
| Liberal Democrats | Susan Ford | 174 | 7.3 | ||
| Majority | 209 | 8.7 | |||
| Turnout | 2,393 | 26.4 | |||
| BNP gain from Labour | Swing | ||||
| Party | Candidate | Votes | % | ±% | |
|---|---|---|---|---|---|
| City Independents | John Gilbert Davis | 729 | 34.7 | ||
| Labour | Terence Frederick Crowe | 654 | 31.1 | ||
| Conservative | Richard John William Ibbs | 434 | 20.6 | ||
| Liberal Democrats | John Phillip Redfern | 286 | 13.6 | ||
| Majority | 75 | 3.6 | |||
| Turnout | 2,103 | 27.1 | |||
| City Independents gain from Labour | Swing | ||||
| Party | Candidate | Votes | % | ±% | |
|---|---|---|---|---|---|
| City Independent | Roy Stanley Naylor | 1,152 | 44.0 | ||
| Labour | Michael Tappin | 776 | 29.6 | ||
| Conservative | Harold Malcolm Mouat | 469 | 17.9 | ||
| Liberal Democrats | Peter George Chambers | 222 | 8.5 | ||
| Majority | 376 | 14.3 | |||
| Turnout | 2,619 | 27.7 | |||
| City Independents gain from Labour | Swing | ||||
| Party | Candidate | Votes | % | ±% | |
|---|---|---|---|---|---|
| Labour | David Conway | 1,104 | 46.7 | ||
| Potteries Alliance | Malcolm Barber | 513 | 21.7 | ||
| Conservative | Donald Winston Smith | 493 | 20.8 | ||
| Liberal Democrats | Sabrina Ann Bowers | 255 | 10.8 | ||
| Majority | 591 | 25.0 | |||
| Turnout | 2,365 | 26.2 | |||
| Labour hold | Swing | ||||
| Party | Candidate | Votes | % | ±% | |
|---|---|---|---|---|---|
| Labour | Javid Iqbal Najmi | 968 | 39.3 | ||
| Potteries Alliance | Ted Owen | 688 | 27.9 | ||
| Conservative | Gareth Fallows | 349 | 14.2 | ||
| Independent | David Giltrap | 189 | 7.7 | ||
| Liberal Democrats | Diane Thomas | 141 | 5.7 | ||
| Socialist Alternative | Jane Mellalieu | 130 | 5.3 | ||
| Majority | 280 | 11.4 | |||
| Turnout | 2,465 | 27.9 | |||
| Labour gain from Independent | Swing | ||||
| Party | Candidate | Votes | % | ±% | |
|---|---|---|---|---|---|
| City Independent | Janine Taylor | 912 | 35.4 | ||
| Independent | Angela Miller | 579 | 22.5 | ||
| BNP | Craig Arthur Pond | 566 | 22.0 | ||
| Labour | David Eric Roberts | 416 | 16.1 | ||
| Independent | Sylvia Emily Nagington | 103 | 4.0 | ||
| Majority | 333 | 12.9 | |||
| Turnout | 2,576 | 27.9 | |||
| City Independent gain from Independent | Swing | ||||
| Party | Candidate | Votes | % | ±% | |
|---|---|---|---|---|---|
| Conservative | Joanne Clare Powell-Beckett | 1,146 | 43.8 | ||
| Labour | Sybil Halfpenny | 713 | 27.3 | ||
| Potteries Alliance | Christine Knight | 509 | 19.5 | ||
| City Independent | Jackie Ward | 247 | 9.4 | ||
| Majority | 433 | 16.6 | |||
| Turnout | 2,615 | 26.3 | |||
| Conservative gain from Labour | Swing | ||||
| Party | Candidate | Votes | % | ±% | |
|---|---|---|---|---|---|
| City Independent | Mick Bell | 1,150 | 39.3 | ||
| BNP | Samuel Richard Tunstall | 779 | 26.6 | ||
| Labour | Stan Bate | 578 | 19.7 | ||
| Conservative | Steven John Morris | 292 | 10.0 | ||
| Liberal Democrats | Thomas Harry Grocock | 129 | 4.4 | ||
| Majority | 371 | 12.7 | |||
| Turnout | 2,928 | 31.7 | |||
| City Independent gain from Labour | Swing | ||||
| Party | Candidate | Votes | % | ±% | |
|---|---|---|---|---|---|
| Liberal Democrats | Zulfiqar Ali | 977 | 49.5 | ||
| Labour | Marj Bate | 743 | 37.6 | ||
| Independent | Jim Piper | 217 | 11.0 | ||
| Independent | Marek Goslicki | 37 | 1.9 | ||
| Majority | 234 | 11.9 | |||
| Turnout | 1,974 | 23.9 | |||
| Liberal Democrats gain from Labour | Swing | ||||
| Party | Candidate | Votes | % | ±% | |
|---|---|---|---|---|---|
| Independent | Randy Conteh | 1,263 | 46.4 | ||
| Conservative | Stephen Andrew Brown | 543 | 20.0 | ||
| Liberal Democrats | Jonathan Taylor | 499 | 18.3 | ||
| Labour | Adam William Colclough | 415 | 15.3 | ||
| Majority | 720 | 26.5 | |||
| Turnout | 2,720 | 30.5 | |||
| Independent hold | Swing | ||||
| Party | Candidate | Votes | % | ±% | |
|---|---|---|---|---|---|
| Labour | Thomas Anthony William Reynolds | 1,005 | 30.7 | ||
| BNP | Pauline Smith | 844 | 25.8 | ||
| Independent | Mark Leat | 578 | 17.7 | ||
| Conservative | Alexander Hayward | 550 | 16.8 | ||
| Independent | Roy Bennett | 292 | 8.9 | ||
| Majority | 239 | 7.3 | |||
| Turnout | 3,269 | 30.9 | |||
| Labour gain from BNP | Swing | ||||
| Party | Candidate | Votes | % | ±% | |
|---|---|---|---|---|---|
| Labour | Bagh Ali | 1,633 | 42.0 | ||
| Conservative | James Whitehurst | 797 | 20.5 | ||
| BNP | Lynne Pond | 756 | 19.4 | ||
| Liberal Democrats | Geoffrey Harold Jenkinson | 569 | 14.6 | ||
| Independent | Rob Kettle | 132 | 3.4 | ||
| Majority | 836 | 21.5 | |||
| Turnout | 3,887 | 26.4 | |||
| Labour hold | Swing | ||||
| Party | Candidate | Votes | % | ±% | |
|---|---|---|---|---|---|
| BNP | John William Burgess | 979 | 30.3 | ||
| City Independent | Christine Follows | 909 | 28.1 | ||
| Conservative | Abigail Margaret Brown | 774 | 23.9 | ||
| Labour | Kath Banks | 570 | 17.6 | ||
| Majority | 70 | 2.2 | |||
| Turnout | 3,232 | 32.4 | |||
| BNP gain from Conservative | Swing | ||||
| Party | Candidate | Votes | % | ±% | |
|---|---|---|---|---|---|
| Liberal Democrats | Dave Sutton | 624 | 22.9 | ||
| Independent | Eve Mary Maley | 623 | 22.9 | ||
| BNP | Stanley Leese | 594 | 21.8 | ||
| Potteries Alliance | Reginald Booth | 500 | 18.4 | ||
| Labour | Barry George Stockley | 379 | 13.9 | ||
| Majority | 1 | 0.0 | |||
| Turnout | 2,720 | 29.8 | |||
| Liberal Democrats gain from Labour | Swing | ||||
| Party | Candidate | Votes | % | ±% | |
|---|---|---|---|---|---|
| Independent | Mick Salih | 1,225 | 44.4 | ||
| Independent | Robert Douglas Hooper | 1,148 | 41.7 | ||
| Labour | Richard Anthony Blake | 383 | 13.9 | ||
| Majority | 77 | 2.8 | |||
| Turnout | 2,756 | 31.3 | |||
| Independent gain from Labour | Swing | ||||
| Party | Candidate | Votes | % | ±% | |
|---|---|---|---|---|---|
| Independent | Pauline Joynson | 824 | 32.2 | ||
| Liberal Democrats | Conrad Lubinski | 590 | 23.1 | ||
| Conservative | Harold David Gregory | 424 | 16.6 | ||
| Labour | Margaret Lilley | 376 | 14.7 | ||
| Independent | Monica Mitchell | 298 | 11.7 | ||
| Independent | Spencer Mervyn Cartlidge | 45 | 1.8 | ||
| Majority | 234 | 9.2 | |||
| Turnout | 2,557 | 26.8 | |||
| Independent gain from Liberal Democrats | Swing | ||||
| Party | Candidate | Votes | % | ±% | |
|---|---|---|---|---|---|
| City Independent | Terry Follows | 2,087 | 56.2 | ||
| Conservative | Shaun Lee Bennett | 1,104 | 29.7 | ||
| Labour | Alistair Scott Watson | 288 | 7.8 | ||
| Liberal Democrats | Christine Grocock | 234 | 6.3 | ||
| Majority | 983 | 26.5 | |||
| Turnout | 3,713 | 38.1 | |||
| City Independents gain from Conservative | Swing | ||||
| Party | Candidate | Votes | % | ±% | |
|---|---|---|---|---|---|
| Independent | Megan Ryan | 1,143 | 36.9 | ||
| BNP | Terence Francis Cope | 813 | 26.3 | ||
| Labour | Shiela Grace Pitt | 703 | 22.7 | ||
| Conservative | Stewart Bertram Jones | 327 | 10.6 | ||
| Independent | Albert Edwin Hurst | 110 | 3.6 | ||
| Majority | 330 | 10.7 | |||
| Turnout | 3,096 | 31.4 | |||
| Independent gain from Labour | Swing | ||||
| Party | Candidate | Votes | % | ±% | |
|---|---|---|---|---|---|
| Conservative | John Clement Daniels | 1,044 | 32.3 | ||
| BNP | Anthony Steven Tabbinor | 968 | 30.0 | ||
| Labour | Ian Philip McLaughlan | 930 | 28.8 | ||
| Independent | Gordon Perry | 287 | 8.9 | ||
| Majority | 76 | 2.4 | |||
| Turnout | 3,229 | 35.2 | |||
| Conservative gain from Labour | Swing | ||||
This article is issued from Wikipedia. The text is licensed under Creative Commons - Attribution - Sharealike. Additional terms may apply for the media files.