Bras-Panon | |
|---|---|
 | |
.svg.png.webp) Coat of arms | |
| |
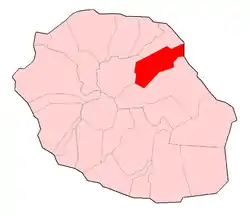
Location of Bras-Panon | |
| Coordinates: 20°59′43″S 55°40′34″E / 20.9953°S 55.6761°E | |
| Country | France |
| Overseas region and department | Réunion |
| Arrondissement | Saint-Benoît |
| Canton | Saint-André-3 |
| Intercommunality | Réunion Est |
| Government | |
| • Mayor (2020–2026) | Jeannick Atchapa[1] |
| Area 1 | 88.55 km2 (34.19 sq mi) |
| Population | 13,344 |
| • Density | 150/km2 (390/sq mi) |
| Time zone | UTC+04:00 |
| INSEE/Postal code | 97402 /97412 |
| Elevation | 0–2,092 m (0–6,864 ft) (avg. 52 m or 171 ft) |
| 1 French Land Register data, which excludes lakes, ponds, glaciers > 1 km2 (0.386 sq mi or 247 acres) and river estuaries. | |
Bras-Panon (French pronunciation: [bʁa panɔ̃]) is a commune in the department and region of Réunion, France. It borders the communes of Saint-André, Saint-Benoît and Salazie; as well as the Mât river, the Rivière des Roches and the Indian Ocean.
The commune is a large producer of vanilla, and holds the largest Agricultural Show on the island, every May.
Geography
Climate
Bras-Panon has a tropical rainforest climate (Köppen climate classification Af). The average annual temperature in Bras-Panon is 20.8 °C (69.4 °F). The average annual rainfall is 4,665.2 mm (183.67 in) with February as the wettest month. The temperatures are highest on average in February, at around 23.7 °C (74.7 °F), and lowest in August, at around 18.0 °C (64.4 °F). The highest temperature ever recorded in Bras-Panon was 32.4 °C (90.3 °F) on 13 February 2018; the coldest temperature ever recorded was 10.5 °C (50.9 °F) on 2 July 2005.
| Climate data for Bras-Panon (1991−2020 normals, extremes 1990−present) | |||||||||||||
|---|---|---|---|---|---|---|---|---|---|---|---|---|---|
| Month | Jan | Feb | Mar | Apr | May | Jun | Jul | Aug | Sep | Oct | Nov | Dec | Year |
| Record high °C (°F) | 31.5 (88.7) |
32.4 (90.3) |
32.2 (90.0) |
30.5 (86.9) |
28.8 (83.8) |
28.1 (82.6) |
26.7 (80.1) |
26.3 (79.3) |
27.2 (81.0) |
28.4 (83.1) |
29.8 (85.6) |
31.1 (88.0) |
32.4 (90.3) |
| Mean daily maximum °C (°F) | 26.5 (79.7) |
26.8 (80.2) |
26.3 (79.3) |
25.5 (77.9) |
23.8 (74.8) |
22.0 (71.6) |
21.0 (69.8) |
21.1 (70.0) |
21.7 (71.1) |
22.8 (73.0) |
24.2 (75.6) |
25.7 (78.3) |
24.0 (75.2) |
| Daily mean °C (°F) | 23.4 (74.1) |
23.7 (74.7) |
23.3 (73.9) |
22.4 (72.3) |
20.7 (69.3) |
19.0 (66.2) |
18.0 (64.4) |
18.0 (64.4) |
18.5 (65.3) |
19.6 (67.3) |
20.9 (69.6) |
22.5 (72.5) |
20.8 (69.4) |
| Mean daily minimum °C (°F) | 20.4 (68.7) |
20.7 (69.3) |
20.2 (68.4) |
19.3 (66.7) |
17.7 (63.9) |
16.0 (60.8) |
15.1 (59.2) |
15.0 (59.0) |
15.3 (59.5) |
16.4 (61.5) |
17.6 (63.7) |
19.2 (66.6) |
17.7 (63.9) |
| Record low °C (°F) | 17.1 (62.8) |
17.4 (63.3) |
16.8 (62.2) |
15.7 (60.3) |
11.5 (52.7) |
12.4 (54.3) |
10.5 (50.9) |
11.1 (52.0) |
11.4 (52.5) |
10.9 (51.6) |
12.0 (53.6) |
15.0 (59.0) |
10.5 (50.9) |
| Average precipitation mm (inches) | 637.7 (25.11) |
738.2 (29.06) |
653.6 (25.73) |
409.8 (16.13) |
349.9 (13.78) |
264.2 (10.40) |
254.0 (10.00) |
254.3 (10.01) |
222.1 (8.74) |
213.7 (8.41) |
241.2 (9.50) |
426.5 (16.79) |
4,665.2 (183.67) |
| Average precipitation days (≥ 1.0 mm) | 21.5 | 19.4 | 20.7 | 18.7 | 17.2 | 15.1 | 17.3 | 17.6 | 16.5 | 16.6 | 15.1 | 19.2 | 214.9 |
| Source: Météo-France[3] | |||||||||||||
Population
| Year | Pop. | ±% p.a. |
|---|---|---|
| 1967 | 5,533 | — |
| 1974 | 5,941 | +1.02% |
| 1982 | 6,945 | +1.97% |
| 1990 | 8,455 | +2.49% |
| 1999 | 9,683 | +1.52% |
| 2007 | 11,216 | +1.85% |
| 2012 | 12,298 | +1.86% |
| 2017 | 12,811 | +0.82% |
| Source: INSEE[4] | ||
See also
References
- ↑ "Répertoire national des élus: les maires". data.gouv.fr, Plateforme ouverte des données publiques françaises (in French). 2 December 2020.
- ↑ "Populations légales 2021". The National Institute of Statistics and Economic Studies. 28 December 2023.
- ↑ "Fiche Climatologique Statistiques 1991-2020 et records" (PDF) (in French). Météo-France. Retrieved August 28, 2022.
- ↑ Population en historique depuis 1968, INSEE
External links