Fanas | |
|---|---|
 Coat of arms | |
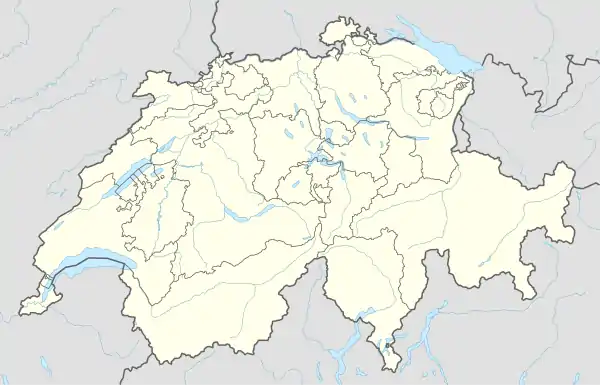
Location of Fanas | |
  Fanas 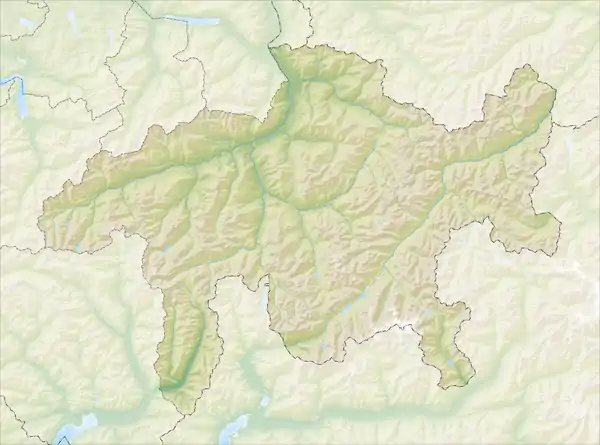 Fanas | |
| Coordinates: 46°59′N 9°39′E / 46.983°N 9.650°E | |
| Country | Switzerland |
| Canton | Graubünden |
| District | Prättigau/Davos |
| Government | |
| • Mayor | Hans Ulrich Gansner |
| Area | |
| • Total | 21.84 km2 (8.43 sq mi) |
| Elevation | 907 m (2,976 ft) |
| Population (31 December 2010) | |
| • Total | 401 |
| • Density | 18/km2 (48/sq mi) |
| Time zone | UTC+01:00 (Central European Time) |
| • Summer (DST) | UTC+02:00 (Central European Summer Time) |
| Postal code(s) | 7215 |
| SFOS number | 3971 |
| Surrounded by | Grüsch, Schiers, Seewis im Prättigau |
| Website | www SFSO statistics |
Fanas is a Swiss village in the Prättigau and a former municipality in the political district of Prättigau/Davos in the canton of Graubünden. On 1 January 2011 Fanas and Valzeina were merged with the municipality of Grüsch.
History
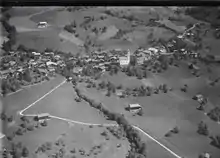
Fanas is first mentioned in second half of the 12th Century as Phanaunes.[1]
Geography
Fanas has an area, as of 2006, of 21.8 km2 (8.4 sq mi). Of this area, 45% is used for agricultural purposes, while 36.8% is forested. Of the rest of the land, 0.7% is settled (buildings or roads) and the remainder (17.5%) is non-productive (rivers, glaciers or mountains).[2]
The municipality is located in the Seewis sub-district of the Prättigau/Davos district on a terrace between Grüsch and Schiers. It consists of the linear village of Fanas.
Demographics
Fanas has a population (as of 31 December 2010) of 401.[3] As of 2008, 3.1% of the population was made up of foreign nationals.[4] Over the last 10 years the population has grown at a rate of 3.7%.[2]
As of 2000, the gender distribution of the population was 47.3% male and 52.7% female.[5] The age distribution, as of 2000, in Fanas is; 47 children or 12.5% of the population are between 0 and 9 years old and 42 teenagers or 11.1% are between 10 and 19. Of the adult population, 39 people or 10.3% of the population are between 20 and 29 years old. 48 people or 12.7% are between 30 and 39, 62 people or 16.4% are between 40 and 49, and 55 people or 14.6% are between 50 and 59. The senior population distribution is 38 people or 10.1% of the population are between 60 and 69 years old, 32 people or 8.5% are between 70 and 79, there are 13 people or 3.4% who are between 80 and 89 there is 1 person who is between 90 and 99.[4]
In the 2007 federal election the most popular party was the SVP which received 42.9% of the vote. The next three most popular parties were the FDP (26.4%), the SP (19.9%) and the CVP (6.2%).[2]
The entire Swiss population is generally well educated. In Fanas about 75.6% of the population (between age 25-64) have completed either non-mandatory upper secondary education or additional higher education (either University or a Fachhochschule).[2]
Fanas has an unemployment rate of 0.94%. As of 2005, there were 34 people employed in the primary economic sector and about 12 businesses involved in this sector. 26 people are employed in the secondary sector and there are 7 businesses in this sector. 28 people are employed in the tertiary sector, with 13 businesses in this sector.[2]
The historical population is given in the following table:[1]
| year | population |
|---|---|
| 1850 | 373 |
| 1900 | 282 |
| 1920 | 250 |
| 1950 | 303 |
| 1970 | 226 |
| 2000 | 377 |
Languages
Most of the population (as of 2000) speaks German (98.1%), with French being second most common ( 0.8%) and Swedish being third ( 0.5%).[2] Originally the village spoke Romansh, but by the mid 16th Century the majority spoke German.
| Languages in Fanas | ||||||
| Languages | Census 1980 | Census 1990 | Census 2000 | |||
| Number | Percent | Number | Percent | Number | Percent | |
| German | 271 | 97.48% | 333 | 96.24% | 370 | 98.14% |
| Romansh | 2 | 0.72% | 0 | 0.00% | 1 | 0.27% |
| Population | 278 | 100% | 346 | 100% | 377 | 100% |
References
- 1 2 Fanas in German, French and Italian in the online Historical Dictionary of Switzerland.
- 1 2 3 4 5 6 Swiss Federal Statistical Office Archived September 4, 2011, at the Wayback Machine accessed 30-Oct-2009
- ↑ Swiss Federal Statistics Office – STAT-TAB Ständige und Nichtständige Wohnbevölkerung nach Region, Geschlecht, Nationalität und Alter (in German) accessed 10 December 2011
- 1 2 Graubunden Population Statistics Archived August 27, 2009, at the Wayback Machine (in German) accessed 21 September 2009
- ↑ Graubunden in Numbers Archived September 24, 2009, at the Wayback Machine (in German) accessed 21 September 2009

External links
- Official Web site (in German)