| Palladam | |
|---|---|
| Constituency No. 115 for the Tamil Nadu Legislative Assembly | |
 | |
| Constituency details | |
| Country | India |
| Region | South India |
| State | Tamil Nadu |
| District | Tiruppur |
| LS constituency | Coimbatore |
| Established | 1957 |
| Total electors | 3,89,786[1] |
| Reservation | None |
| Member of Legislative Assembly | |
| 16th Tamil Nadu Legislative Assembly | |
| Incumbent | |
| Party | AIADMK |
| Elected year | 2021 |
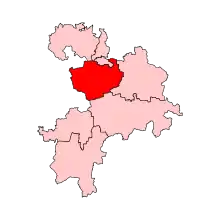
Palladam is a legislative assembly in Tiruppur district, which includes the town, Palladam.[2] Palladam assembly constituency is a part of Coimbatore Lok Sabha constituency.[3] The constituency is in existence since 1957 election. It is one of the 234 State Legislative Assembly Constituencies in Tamil Nadu, in India.
Demographics
Gender demographics of Palladam constituency as of 01.04.2021,[4] taken ahead of the State General election in Tamilnadu in 2021.
| Year | Female | Male | Transgender | Total |
|---|---|---|---|---|
| 2021 | 1,93,139 | 1,93,904 | 68 | 3,87,111 |
Madras State
| Year | Winner | Party | |
|---|---|---|---|
| 1957 | P. S. Chinnadurai | Praja Socialist Party | |
| 1962 | Sengaliappan | Indian National Congress | |
| 1967 | K. N. Kumarasamy Gounder | Praja Socialist Party | |
Tamil Nadu
| Assembly | Duration | Winner | Party | |
|---|---|---|---|---|
| Fifth | 1971-77 | K. N. Kumarasamy Gounder | Praja Socialist Party | |
| Sixth | 1977-80 | P. G. Kittu | All India Anna Dravida Munnetra Kazhagam | |
| Seventh | 1980-84 | P. N. Paramasiva Gounder | ||
| Eighth | 1984-89 | |||
| Ninth | 1989-91 | M. Kannappan | Dravida Munnetra Kazhagam | |
| Tenth | 1991-96 | K. S. Duraimurugan | All India Anna Dravida Munnetra Kazhagam | |
| Eleventh | 1996-01 | S. S. Ponmudi | Dravida Munnetra Kazhagam | |
| Twelfth | 2001-06 | S. M. Velusamy | All India Anna Dravida Munnetra Kazhagam | |
| Thirteenth | 2006-11 | |||
| Fourteenth | 2011-2016 | K. P. Paramasivam | ||
| Fifteenth | 2016 | A.Natarajan | ||
| Sixteenth | 2021 | M. S. M. Anandan | ||
2021 Elections
Constituency details
| Men | Women | Third Gender | Total |
|---|---|---|---|
| 1,87,927 | 1,87,852 | 60 | 3,75,838[5] |
Election results
2021
| Party | Candidate | Votes | % | ±% | |
|---|---|---|---|---|---|
| AIADMK | M. S. M. Anandan | 126,903 | 48.86% | +1.85 | |
| DMK | K. Muthu Rathinam | 94,212 | 36.28% | +2.79 | |
| NTK | S. Subramanian | 20,524 | 7.90% | +6.68 | |
| MNM | G. Mayilsamy | 10,227 | 3.94% | New | |
| AMMK | R. Jothimani | 2,618 | 1.01% | New | |
| NOTA | NOTA | 1,802 | 0.69% | -0.95 | |
| Margin of victory | 32,691 | 12.59% | -0.93% | ||
| Turnout | 259,709 | 66.63% | -5.05% | ||
| Rejected ballots | 98 | 0.04% | |||
| Registered electors | 389,786 | ||||
| AIADMK hold | Swing | 1.85% | |||
2016
| Party | Candidate | Votes | % | ±% | |
|---|---|---|---|---|---|
| AIADMK | A. Natarajan | 111,866 | 47.01% | -19.77 | |
| DMK | S. Krishna Moorthy | 79,692 | 33.49% | New | |
| MDMK | K. Muthu Rathinam | 14,841 | 6.24% | New | |
| BJP | S. Thangaraj | 13,127 | 5.52% | +3.02 | |
| KMDK | C. Rajendran | 6,572 | 2.76% | New | |
| NOTA | NOTA | 3,904 | 1.64% | New | |
| NTK | T. Velusamy | 2,911 | 1.22% | New | |
| PMK | S. Kumar | 2,292 | 0.96% | New | |
| Independent | G. Nataraj | 1,547 | 0.65% | New | |
| Margin of victory | 32,174 | 13.52% | -25.92% | ||
| Turnout | 237,966 | 71.68% | -5.71% | ||
| Registered electors | 331,995 | ||||
| AIADMK hold | Swing | -19.77% | |||
2011
| Party | Candidate | Votes | % | ±% | |
|---|---|---|---|---|---|
| AIADMK | K. P. Paramasivam | 118,140 | 66.78% | +23.05 | |
| KNMK | K. Balasubramanian | 48,364 | 27.34% | New | |
| BJP | M. Shanmuga Sundaram | 4,423 | 2.50% | +0.41 | |
| Independent | A. Annadurai | 2,693 | 1.52% | New | |
| Independent | R. Annadurai | 1,819 | 1.03% | New | |
| Independent | M. Senthilmurugan | 1,471 | 0.83% | New | |
| Margin of victory | 69,776 | 39.44% | 36.14% | ||
| Turnout | 228,611 | 77.38% | 6.65% | ||
| Registered electors | 176,910 | ||||
| AIADMK hold | Swing | 23.05% | |||
2006
| Party | Candidate | Votes | % | ±% | |
|---|---|---|---|---|---|
| AIADMK | S. M. Velusamy | 73,059 | 43.73% | -12.13 | |
| DMK | S. S. Ponmudi | 67,542 | 40.42% | +6.53 | |
| DMDK | G. Subramaniam | 19,697 | 11.79% | New | |
| BJP | P. M. Thirumurthy | 3,492 | 2.09% | New | |
| BSP | S. P. Mylswamy | 1,226 | 0.73% | New | |
| Independent | A. S. Rajendran | 927 | 0.55% | New | |
| Margin of victory | 5,517 | 3.30% | -18.66% | ||
| Turnout | 167,080 | 70.73% | 10.49% | ||
| Registered electors | 236,223 | ||||
| AIADMK hold | Swing | -12.13% | |||
2001
| Party | Candidate | Votes | % | ±% | |
|---|---|---|---|---|---|
| AIADMK | S. M. Velusamy | 82,592 | 55.86% | +24.72 | |
| DMK | S. S. Ponmudi | 50,118 | 33.89% | -21.74 | |
| MDMK | C. Ponnusamy | 10,410 | 7.04% | -1.77 | |
| Janata Dal (Secular) | S. P. Muthulingam | 1,514 | 1.02% | New | |
| Independent | P. Velusamy | 1,514 | 1.02% | New | |
| Margin of victory | 32,474 | 21.96% | -2.54% | ||
| Turnout | 147,864 | 60.24% | -8.88% | ||
| Registered electors | 245,455 | ||||
| AIADMK gain from DMK | Swing | 0.22% | |||
1996
| Party | Candidate | Votes | % | ±% | |
|---|---|---|---|---|---|
| DMK | S. S. Ponmudi | 73,901 | 55.64% | +23.22 | |
| AIADMK | K. S. Duraimurugan | 41,361 | 31.14% | -29.89 | |
| MDMK | A. Ku. Palanisamy | 11,707 | 8.81% | New | |
| BJP | G. Rangasamy Naidu | 2,796 | 2.11% | -2.09 | |
| Margin of victory | 32,540 | 24.50% | -4.11% | ||
| Turnout | 132,825 | 69.12% | 4.03% | ||
| Registered electors | 200,271 | ||||
| DMK gain from AIADMK | Swing | -5.39% | |||
1991
| Party | Candidate | Votes | % | ±% | |
|---|---|---|---|---|---|
| AIADMK | K. S. Duraimurugan | 69,803 | 61.03% | +33.61 | |
| DMK | M. Kannappan | 37,079 | 32.42% | -6.7 | |
| BJP | A. Bala Dhandapani | 4,797 | 4.19% | New | |
| PMK | C. Murugan | 684 | 0.60% | New | |
| Margin of victory | 32,724 | 28.61% | 16.91% | ||
| Turnout | 114,376 | 65.09% | -9.02% | ||
| Registered electors | 183,291 | ||||
| AIADMK gain from DMK | Swing | 21.91% | |||
1989
| Party | Candidate | Votes | % | ±% | |
|---|---|---|---|---|---|
| DMK | M. Kannappan | 45,395 | 39.12% | New | |
| AIADMK | K. Sivaraj | 31,819 | 27.42% | -26.55 | |
| INC | Sivaji Kandessamy | 24,980 | 21.53% | New | |
| AIADMK | K. C. Palanisamy | 10,986 | 9.47% | -44.5 | |
| Independent | C. Subramanian | 779 | 0.67% | New | |
| Margin of victory | 13,576 | 11.70% | 0.53% | ||
| Turnout | 116,038 | 74.11% | 1.80% | ||
| Registered electors | 159,768 | ||||
| DMK gain from AIADMK | Swing | -14.85% | |||
1984
| Party | Candidate | Votes | % | ±% | |
|---|---|---|---|---|---|
| AIADMK | P. N. Paramasiva Gounder | 51,083 | 53.97% | +5.61 | |
| Independent | Sivasamy | 40,510 | 42.80% | New | |
| Independent | P. K. Kittu | 950 | 1.00% | New | |
| Independent | Thangavelu | 815 | 0.86% | New | |
| Margin of victory | 10,573 | 11.17% | 1.62% | ||
| Turnout | 94,647 | 72.31% | 6.44% | ||
| Registered electors | 138,075 | ||||
| AIADMK hold | Swing | 5.61% | |||
1980
| Party | Candidate | Votes | % | ±% | |
|---|---|---|---|---|---|
| AIADMK | P. N. Paramasiva Gounder | 40,305 | 48.36% | +15.25 | |
| INC | K. N. Kumarasamy Gounder | 32,345 | 38.81% | +14.23 | |
| JP | S. Ramaswamy | 7,861 | 9.43% | New | |
| Independent | A. P. Muthuswamy | 2,826 | 3.39% | New | |
| Margin of victory | 7,960 | 9.55% | 1.03% | ||
| Turnout | 83,337 | 65.87% | -0.46% | ||
| Registered electors | 128,604 | ||||
| AIADMK hold | Swing | 15.25% | |||
1977
| Party | Candidate | Votes | % | ±% | |
|---|---|---|---|---|---|
| AIADMK | P. G. Kittu | 27,172 | 33.11% | New | |
| INC | K. N. Kumarasamy Gounder | 20,175 | 24.58% | -10.2 | |
| JP | R. Krishnasamy Gounder | 19,379 | 23.61% | New | |
| DMK | R. C. Kandasamy | 14,658 | 17.86% | New | |
| Independent | C. Chinnia Gonuder | 684 | 0.83% | New | |
| Margin of victory | 6,997 | 8.53% | -14.26% | ||
| Turnout | 82,068 | 66.34% | -0.73% | ||
| Registered electors | 125,740 | ||||
| AIADMK gain from PSP | Swing | -24.46% | |||
1971
| Party | Candidate | Votes | % | ±% | |
|---|---|---|---|---|---|
| PSP | K. N. Kumarasamy Gounder | 34,876 | 57.57% | New | |
| INC | R. Sengaliappan | 21,070 | 34.78% | -1.11 | |
| CPI(M) | Arangaramurthi | 4,637 | 7.65% | New | |
| Margin of victory | 13,806 | 22.79% | 11.68% | ||
| Turnout | 60,583 | 67.06% | -8.98% | ||
| Registered electors | 99,853 | ||||
| PSP hold | Swing | 10.58% | |||
1967
| Party | Candidate | Votes | % | ±% | |
|---|---|---|---|---|---|
| PSP | K. N. Kumarasamy Gounder | 31,977 | 46.99% | New | |
| INC | R. Sengaliappan | 24,421 | 35.89% | -15.78 | |
| Independent | M. V. Gounder | 11,650 | 17.12% | New | |
| Margin of victory | 7,556 | 11.10% | -17.79% | ||
| Turnout | 68,048 | 76.04% | 2.83% | ||
| Registered electors | 95,869 | ||||
| PSP gain from INC | Swing | -4.67% | |||
1962
| Party | Candidate | Votes | % | ±% | |
|---|---|---|---|---|---|
| INC | R. Sengaliappan | 33,437 | 51.66% | +14.3 | |
| PSP | P. S. Chinnadurai | 14,736 | 22.77% | New | |
| CPI | K. R. Ramasamy | 10,247 | 15.83% | New | |
| DMK | Palamisamy | 4,778 | 7.38% | New | |
| Socialist | Gopalasamy | 1,523 | 2.35% | New | |
| Margin of victory | 18,701 | 28.89% | 8.43% | ||
| Turnout | 64,721 | 73.22% | 21.59% | ||
| Registered electors | 92,464 | ||||
| INC gain from PSP | Swing | -6.17% | |||
1957
| Party | Candidate | Votes | % | ±% | |
|---|---|---|---|---|---|
| PSP | P. S. Chinnadurai | 27,111 | 57.83% | New | |
| INC | Kumarasami Gounder | 17,515 | 37.36% | New | |
| Independent | Ponnusami | 2,255 | 4.81% | New | |
| Margin of victory | 9,596 | 20.47% | |||
| Turnout | 46,881 | 51.63% | |||
| Registered electors | 90,803 | ||||
| PSP win (new seat) | |||||
References
- ↑ "Form 21E (Return of Election)" (PDF). Archived from the original (PDF) on 24 December 2021. Retrieved 10 February 2022.
- ↑ "Tamil Nadu Legislative Assembly Constituency Map". Tamil Nadu Legislative Assembly. Retrieved 23 January 2017.
- ↑ "List of Parliamentary and Assembly Constituencies" (PDF). Tamil Nadu. Election Commission of India. Archived from the original (PDF) on 6 February 2009. Retrieved 10 October 2008.
- ↑ "Patrikai.com 01.04.2021 Voters Count".
- ↑ "Palladam : பல்லடம் சட்டப்பேரவைத் தொகுதி ஒரு பார்வை". News18 Tamil.
- ↑ "palladam Election Result". Retrieved 12 June 2022.
- ↑ "Assembly wise Candidate Valid Votes count 2016, Tamil Nadu" (PDF). www.elections.tn.gov.in. Archived from the original (PDF) on 30 April 2022. Retrieved 30 April 2022.
- ↑ Detailes Result 2011, Aseembly Election Tamil Nadu (PDF). Election Commission of Tamil Nadu (Report). Archived from the original (PDF) on 15 February 2017. Retrieved 9 May 2021.
- ↑ Election Commission of India. "2006 Election Statistical Report" (PDF). Archived from the original (PDF) on 7 October 2010. Retrieved 12 May 2006.
- ↑ Election Commission of India (12 May 2001). "Statistical Report on General Election 2001" (PDF). Archived from the original (PDF) on 6 October 2010.
- ↑ Election Commission of India. "1996 Election Statistical Report" (PDF). Archived from the original (PDF) on 7 October 2010. Retrieved 19 April 2009.
- ↑ Election Commission of India. "Statistical Report on General Election 1991" (PDF). Archived from the original (PDF) on 7 October 2010. Retrieved 19 April 2009.
- ↑ Election Commission of India. "Statistical Report on General Election 1989" (PDF). Archived from the original (PDF) on 6 October 2010. Retrieved 19 April 2009.
- ↑ Election Commission of India. "Statistical Report on General Election 1984" (PDF). Archived from the original (PDF) on 17 January 2012. Retrieved 19 April 2009.
- ↑ Election Commission of India. "Statistical Report on General Election 1980" (PDF). Archived from the original (PDF) on 6 October 2010. Retrieved 19 April 2009.
- ↑ Election Commission of India. "Statistical Report on General Election 1977" (PDF). Archived from the original (PDF) on 7 October 2010. Retrieved 19 April 2009.
- ↑ Election Commission of India. "Statistical Report on General Election 1971" (PDF). Archived from the original (PDF) on 6 October 2010. Retrieved 19 April 2009.
- ↑ Election Commission of India. "Statistical Report on General Election 1967" (PDF). Archived from the original (PDF) on 20 March 2012. Retrieved 19 April 2009.
- ↑ Election Commission of India. "Statistical Report on General Election 1962" (PDF). Archived from the original (PDF) on 27 January 2013. Retrieved 19 April 2009.
- ↑ Election Commission of India. "Statistical Report on General Election 1957" (PDF). Archived from the original (PDF) on 27 January 2013. Retrieved 26 July 2015.
- "Statistical reports of assembly elections". Election Commission of India. Archived from the original on 5 October 2010. Retrieved 8 July 2010.
This article is issued from Wikipedia. The text is licensed under Creative Commons - Attribution - Sharealike. Additional terms may apply for the media files.