Redbridge London Borough Council in London, England is elected every four years.
Political control
The first election to the council was held in 1964, initially operating as a shadow authority ahead of the new system coming into full effect the following year. Since 1964 political control of the council has been held by the following parties:
| Party in control | Years | |
|---|---|---|
| Conservative | 1964–1994 | |
| No overall control | 1994–2002 | |
| Conservative | 2002–2009 | |
| No overall control | 2009–2014 | |
| Labour | 2014–present | |
Leadership
The leaders of the council since 1965 have been:[1][2]
| Councillor | Party | From | To | |
|---|---|---|---|---|
| Roy Dalton | Conservative | 1965 | 1972 | |
| Alexander Escott | Conservative | 1972 | 1974 | |
| John Telford | Conservative | 1974 | 1975 | |
| Keith Webb | Conservative | 1975 | 1979 | |
| Keith Salter | Conservative | 1979 | 1985 | |
| John Ramsden | Conservative | 1985 | 1988 | |
| John Lovell | Conservative | 1988 | 1991 | |
| Ronnie Barden | Conservative | 1991 | 1994 | |
| Liz Pearce | Labour | 1994 | 1999 | |
| Keith Axon | Conservative | 1999 | 18 May 2000 | |
| Mohammed Javed | Labour | 18 May 2000 | 23 May 2002 | |
| Keith Axon | Conservative | 23 May 2002 | 2 Feb 2003 | |
| Allan Burgess | Conservative | 20 Mar 2003 | 20 May 2004 | |
| Elaine Norman[3] | Labour | 25 May 2004 | 15 Jul 2004 | |
| Laurence Davies | Conservative | 15 Jul 2004 | 7 May 2006 | |
| Alan Weinberg | Conservative | 25 May 2006 | 21 May 2009 | |
| Keith Prince | Conservative | 28 May 2009 | 12 Jun 2014 | |
| Jas Athwal | Labour | 12 Jun 2014 | ||
Council elections
- 1964 Redbridge London Borough Council election
- 1968 Redbridge London Borough Council election
- 1971 Redbridge London Borough Council election
- 1974 Redbridge London Borough Council election
- 1978 Redbridge London Borough Council election (boundary changes increased the number of seats by three)[4]
- 1982 Redbridge London Borough Council election
- 1986 Redbridge London Borough Council election
- 1990 Redbridge London Borough Council election
- 1994 Redbridge London Borough Council election (boundary changes reduced the number of seats by one)[5][n 1][n 2]
- 1998 Redbridge London Borough Council election (boundary changes took place but the number of seats remained the same)[n 3][n 4]
- 2002 Redbridge London Borough Council election (boundary changes increased the number of seats by one)[6]
- 2006 Redbridge London Borough Council election
- 2010 Redbridge London Borough Council election
- 2014 Redbridge London Borough Council election
- 2018 Redbridge London Borough Council election
- 2022 Redbridge London Borough Council election
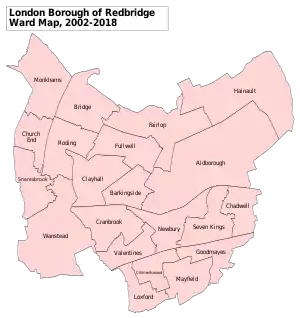
Borough result maps
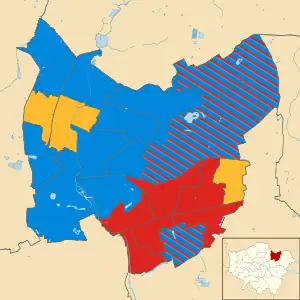 2002 results map
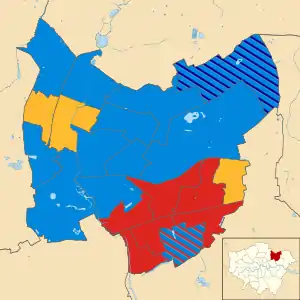 2006 results map
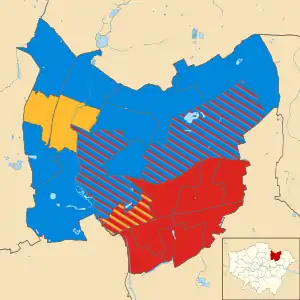 2010 results map
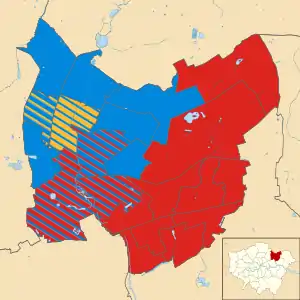 2014 results map
By-election results
1964-1968
There were no by-elections.[7]
1968-1971
| Party | Candidate | Votes | % | ±% | |
|---|---|---|---|---|---|
| Conservative | C. F. Annal | 1646 | |||
| Labour | R. M. Spack | 550 | |||
| Liberal | T. J. Needham | 386 | |||
| National Front | W. J. Partridge | 81 | |||
| Communist | Mrs E. M. Woddis | 58 | |||
| Turnout | 31.2% | ||||
| Party | Candidate | Votes | % | ±% | |
|---|---|---|---|---|---|
| Labour | T. R. Reynolds | 1807 | |||
| Conservative | B. H. Gunby | 738 | |||
| Liberal | J. P. Stonham | 123 | |||
| National Front | R. W. Tear | 102 | |||
| Turnout | 31.5% | ||||
1971-1974
| Party | Candidate | Votes | % | ±% | |
|---|---|---|---|---|---|
| Conservative | B. W. Tarring | 1,609 | |||
| Labour | Mrs T. H. Desmond | 660 | |||
| Liberal | Mrs M. J. Hoskins | 433 | |||
| Turnout | 24.6% | ||||
| Party | Candidate | Votes | % | ±% | |
|---|---|---|---|---|---|
| Labour | W. Finesilver | 1,939 | |||
| Liberal | E. G. Flack | 813 | |||
| Conservative | J. R. Lovell | 523 | |||
| Turnout | 31.0% | ||||
1974-1978
| Party | Candidate | Votes | % | ±% | |
|---|---|---|---|---|---|
| Conservative | Regina Ashton | 1,590 | |||
| Liberal | Richard H. Hoskins | 968 | |||
| Labour | Philip Phillips | 414 | |||
| Turnout | 30.6 | ||||
| Party | Candidate | Votes | % | ±% | |
|---|---|---|---|---|---|
| Conservative | Peter R. Goody | 1,703 | |||
| Liberal | Richard H. Hoskins | 984 | |||
| Labour | David J. Rose | 310 | |||
| Turnout | 29.0 | ||||
| Party | Candidate | Votes | % | ±% | |
|---|---|---|---|---|---|
| Conservative | Leslie G. Bridgeman | 2,413 | |||
| Liberal | Sidney A. Cohen | 450 | |||
| Labour | Gwyneth Phillips | 284 | |||
| Turnout | 23.7 | ||||
| Party | Candidate | Votes | % | ±% | |
|---|---|---|---|---|---|
| Conservative | Carole S. Maddock | 2,597 | |||
| Labour | Charles E. G. Burgess | 1,491 | |||
| Liberal | Gareth L. P. Wilson | 324 | |||
| Turnout | 42.9 | ||||
| Party | Candidate | Votes | % | ±% | |
|---|---|---|---|---|---|
| Conservative | John C. Allan | 1,892 | |||
| Liberal | Alan F. Cornish | 1,166 | |||
| Labour | Gwyneth Phillips | 424 | |||
| Turnout | 29.2 | ||||
| Party | Candidate | Votes | % | ±% | |
|---|---|---|---|---|---|
| Conservative | Michael G. Kirrage | 2,116 | |||
| Labour | Raymond D. Smith | 835 | |||
| National Front | John R. Hughes | 176 | |||
| Liberal | Peter W. Briggs | 155 | |||
| Turnout | 30.2 | ||||
1978-1982
1982-1986
1986-1990
1990-1994
| Party | Candidate | Votes | % | ±% | |
|---|---|---|---|---|---|
| Conservative | Keith R. Langford | 1,122 | 36.5 | ||
| Labour | Joseph B. Hoedemaker | 1,098 | 35.8 | ||
| Liberal Democrats | George G. Hogarth | 851 | 27.7 | ||
| Turnout | 40.2 | ||||
| Conservative hold | Swing | ||||
The by-election was called following the death of Cllr. Arnold Kinzley.
| Party | Candidate | Votes | % | ±% | |
|---|---|---|---|---|---|
| Conservative | Michael J. Stark | 1,407 | 52.3 | ||
| Liberal Democrats | Michael McElarney | 926 | 34.4 | ||
| Labour | Philip J. Pollard | 357 | 13.3 | ||
| Turnout | 34.8 | ||||
| Conservative hold | Swing | ||||
The by-election was called following the death of Cllr. Nancy H. Thurgood.
1994-1998
| Party | Candidate | Votes | % | ±% | |
|---|---|---|---|---|---|
| Labour | John P. Coombes | 1,155 | |||
| Conservative | Graham F. Borratt | 1,078 | |||
| Liberal Democrats | John C. Tyne | 255 | |||
| Turnout | |||||
| Labour hold | Swing | ||||
The by-election was called following the resignation of Cllr. Raymond A. Ward.
| Party | Candidate | Votes | % | ±% | |
|---|---|---|---|---|---|
| Labour | Greer C. Nicholson | 1,673 | 55.1 | ||
| Conservative | Harold W. Moth | 1,174 | 38.7 | ||
| Liberal Democrats | Susanne Newman | 188 | 6.2 | ||
| Majority | 499 | 16.4 | |||
| Turnout | 3,035 | 36.0 | |||
| Labour hold | Swing | ||||
The by-election was called following the death of Cllr. Brian R. Myers.
| Party | Candidate | Votes | % | ±% | |
|---|---|---|---|---|---|
| Conservative | Graham F. Borrott | 1,549 | 47.7 | ||
| Labour | Robert C. Littlewood | 1,525 | 46.9 | ||
| Liberal Democrats | Albert Williamson | 176 | 5.4 | ||
| Majority | 24 | 0.8 | |||
| Turnout | 3,250 | 33.6 | |||
| Conservative hold | Swing | ||||
The by-election was called following the death of Cllr. Thomas F. Cobb.
| Party | Candidate | Votes | % | ±% | |
|---|---|---|---|---|---|
| Labour | Robert C. Littlewood | 1,498 | 61.8 | ||
| Conservative | Munawar H. Shah | 822 | 33.9 | ||
| Liberal Democrats | Narendra Dattani | 102 | 4.2 | ||
| Majority | 676 | 28.1 | |||
| Turnout | 2,422 | 30.7 | |||
| Labour hold | Swing | ||||
The by-election was called following the resignation of Cllr. David A. Masters.
| Party | Candidate | Votes | % | ±% | |
|---|---|---|---|---|---|
| Labour | Richard W. Newcombe | 1,054 | 64.5 | +7.5 | |
| Conservative | Lee Scott | 513 | 31.4 | +3.6 | |
| Liberal Democrats | Kathleen M. Black | 67 | 4.1 | -11.1 | |
| Majority | 541 | 33.1 | |||
| Turnout | 1,634 | 23.4 | |||
| Labour hold | Swing | ||||
The by-election was called following the resignation of Cllr. Linda Perham.
1998-2002
| Party | Candidate | Votes | % | ±% | |
|---|---|---|---|---|---|
| Conservative | Vanessa Cole | 1,013 | 48.7 | +12.7 | |
| Labour | Gary D. Scottow | 942 | 45.3 | -11.1 | |
| Liberal Democrats | Catherine M. Davies | 125 | 6.0 | -1.6 | |
| Majority | 71 | 3.4 | |||
| Turnout | 2,080 | 30.8 | |||
| Conservative gain from Labour | Swing | ||||
The by-election was called following the resignation of Cllr. Desmond M. Thurlby.
2002-2006
| Party | Candidate | Votes | % | ±% | |
|---|---|---|---|---|---|
| Labour | Dev R. Sharma | 1,356 | 47.2 | -5.9 | |
| Conservative | Surenda Patel | 1,313 | 45.7 | +12.1 | |
| CPA | Juliet Hawkins | 206 | 7.2 | +7.2 | |
| Majority | 43 | 1.5 | |||
| Turnout | 2,875 | 30.0 | |||
| Labour hold | Swing | ||||
The by-election was called following the disqualification of Cllr. Dev R. Sharma.
| Party | Candidate | Votes | % | ±% | |
|---|---|---|---|---|---|
| Conservative | Keith A. Prince | 1,468 | 49.0 | -5.0 | |
| Labour | Taifur Rashid | 985 | 32.8 | -1.9 | |
| Liberal Democrats | Matthew Lake | 341 | 11.3 | -0.1 | |
| BNP | Julian Leppert | 116 | 3.9 | +3.9 | |
| CPA | James Hargreaves | 56 | 1.9 | +1.9 | |
| Independent | Martin Levin | 39 | 1.3 | +1.3 | |
| Majority | 483 | 16.2 | |||
| Turnout | 3,005 | 35.2 | |||
| Conservative hold | Swing | ||||
The by-election was called following the death of Cllr. Keith E. Axon.
| Party | Candidate | Votes | % | ±% | |
|---|---|---|---|---|---|
| Conservative | Suresh Kumar | 1,006 | 37.5 | +4.9 | |
| Labour | Lesley R. Hilton | 997 | 37.2 | -4.0 | |
| Liberal Democrats | George G. Hogarth | 422 | 15.7 | +0.2 | |
| CPA | Juliet F. Hawkins | 170 | 6.3 | +6.3 | |
| Green | Ashley Gunstock | 86 | 3.2 | -7.5 | |
| Majority | 9 | 0.3 | |||
| Turnout | 2,681 | 29.6 | |||
| Conservative gain from Labour | Swing | ||||
The by-election was called following the death of Cllr. Gary D. Scottow.
2006-2010
| Party | Candidate | Votes | % | ±% | |
|---|---|---|---|---|---|
| Conservative | Geoffrey D. Hinds | 1,014 | 39.6 | -13.1 | |
| BNP | Daniel Warville | 857 | 33.4 | +33.4 | |
| Labour | Mark A. Epstein | 299 | 11.7 | -7.2 | |
| Liberal Democrats | Angela E. Yeoman | 245 | 9.6 | -5.9 | |
| Green | David I. Reynolds | 147 | 5.7 | -7.1 | |
| Majority | 157 | 6.2 | |||
| Turnout | 2,562 | 30.3 | |||
| Conservative hold | Swing | ||||
The by-election was called following the death of Cllr. James Leal.
| Party | Candidate | Votes | % | ±% | |
|---|---|---|---|---|---|
| Liberal Democrats | Irfan Mustafa | 904 | 41.9 | +30.3 | |
| Labour | Mark A. Santos | 715 | 33.1 | -20.6 | |
| Conservative | Dennis J. Aylen | 377 | 17.5 | -0.5 | |
| Independent | Ben T. Brown | 65 | 3.0 | +3.0 | |
| Green | Timothy S. Randall | 49 | 2.2 | ||
| British Public Party | Kashif Rana | 48 | 2.2 | -9.7 | |
| Majority | 189 | ||||
| Turnout | 25.1 | ||||
| Liberal Democrats gain from Labour | Swing | ||||
The by-election was called following the death of Cllr. Simon Green.
| Party | Candidate | Votes | % | ±% | |
|---|---|---|---|---|---|
| Conservative | Matthew Chaudhary | 1,625 | 60.0 | +7.7 | |
| Labour | Barbara White | 729 | 27.0 | -4.5 | |
| Liberal Democrats | Helen A. Duffett | 318 | 11.7 | -4.5 | |
| BNP | Anthony Young | 37 | 1.3 | +1.3 | |
| Majority | 896 | 33.0 | |||
| Turnout | 2,709 | 30.0 | |||
| Conservative hold | Swing | ||||
The by-election was called following the death of Cllr. Charles Elliman.
| Party | Candidate | Votes | % | ±% | |
|---|---|---|---|---|---|
| Liberal Democrats | Shoaib Patel | 963 | 36.9 | +20.1 | |
| Conservative | Ikram Wahid | 781 | 29.9 | +10.4 | |
| Labour | Surinder Pahl | 756 | 28.9 | -0.3 | |
| Respect | Abdurahman Jafar | 112 | 4.3 | +4.3 | |
| Majority | 182 | ||||
| Turnout | 29.7 | ||||
| Liberal Democrats gain from Labour | Swing | ||||
The by-election was called following the resignation of Cllr. Nadia J. Sharif.
| Party | Candidate | Votes | % | ±% | |
|---|---|---|---|---|---|
| Conservative | Alex Wilson | 1300 | |||
| Liberal Democrats | Ms. Kate Garrett | 1030 | |||
| Labour | Ross J. Hatfull | 694 | |||
| Green | Ashley Gunstock | 256 | |||
| BNP | Alfred Evans John | 171 | |||
| UKIP | Nick Jones | 33 | |||
| Turnout | |||||
| Conservative hold | Swing | ||||
The by-election was called following the death of Cllr. Allan C. Burgess.
2010-2014
| Party | Candidate | Votes | % | ±% | |
|---|---|---|---|---|---|
| Labour | Wes Streeting | 800 | 31.5 | ||
| Conservative | Gary Ian Munro | 580 | 22.9 | ||
| Liberal Democrats | John Charles Tyne | 576 | 22.7 | ||
| Green | Wilson Chowdhry | 413 | 16.3 | ||
| BNP | Julian Peter Leppert | 115 | 4.5 | ||
| UKIP | Paul Kevin Wiffen | 54 | 2.1 | ||
| Majority | 220 | 8.6 | |||
| Turnout | 2,542 | 25.5 | |||
| Labour hold | Swing | ||||
The by-election was called following the disqualification of Cllr. Mark Gittens.
| Party | Candidate | Votes | % | ±% | |
|---|---|---|---|---|---|
| Labour | Debbie Thiara | 1,436 | |||
| Conservative | Melvyn Marks | 1,071 | |||
| Liberal Democrats | Christopher Greaves | 87 | |||
| UKIP | Paul Wiffen | 83 | |||
| Green | Clive Durdle | 64 | |||
| BNP | Danny Warville | 34 | 1.2 | ||
| Majority | 365 | ||||
| Turnout | 2,780 | 24.69 | |||
| Labour hold | Swing | ||||
The by-election was called following the resignation of Cllr. Mike Figg.
2014-2018
| Party | Candidate | Votes | % | ±% | |
|---|---|---|---|---|---|
| Labour | Lloyd Jacob Duddridge | 1,832 | 40.9 | +17.5 | |
| Conservative | Ruth Kim Clark | 1,254 | 28.0 | +2.8 | |
| Liberal Democrats | Richard Clare | 983 | 22.0 | -6.3 | |
| UKIP | Jonathon Emmanuel Seymour | 216 | 4.8 | -9.6 | |
| Green | Barry Cooper | 169 | 3.8 | -4.8 | |
| All People's Party | Marilyn Moore | 22 | 0.5 | +0.5 | |
| Majority | 578 | ||||
| Turnout | 4,515 | 52.4% | +11.8 | ||
| Labour gain from Conservative | Swing | ||||
The by-election was triggered by the resignation of Councillor Sarah Blaber (Conservative).
References
- ↑ "Council minutes". Redbridge Council. Retrieved 10 July 2022.
- ↑ "London Boroughs Political Almanac". London Councils. Retrieved 10 July 2022.
- ↑ "All change at Town Hall". Guardian Series. 31 May 2004. Retrieved 10 July 2022.
- 1 2 3 4 5 6 7 "London Borough Council Elections 4 May 1978" (PDF). London Datastore. Greater London Council. Retrieved 25 February 2015.
- ↑ "London Borough Council Elections 5 May 1994 including Results from the European Elections" (PDF). London Datastore. London Research Centre. Retrieved 25 February 2015.
- 1 2 "London Borough Council Elections 2 May 2002" (PDF). London Datastore. Greater London Authority. Retrieved 25 February 2015.
- ↑ "London Borough Council Elections 9 May 1968" (PDF). London Datastore. Greater London Council. Retrieved 24 February 2015.
- 1 2 "London Borough Council Elections 13 May 1971" (PDF). London Datastore. Greater London Council. Retrieved 3 March 2015.
- 1 2 "London Borough Council Elections 2 May 1974" (PDF). London Datastore. Greater London Council. Retrieved 25 February 2015.
- 1 2 "London Borough Council By-elections May 1990 to May 1994" (PDF). London Datastore. London Research Centre. Retrieved 8 March 2015.
- 1 2 3 4 5 "London Borough Council Elections 7 May 1998 including the Greater London Authority Referendum results" (PDF). London Datastore. London Research Centre. Retrieved 8 March 2015.
- 1 2 3 "London Borough Council Elections 4 May 2006" (PDF). London Datastore. Greater London Authority. Retrieved 7 March 2015.
- 1 2 "Local by-elections results". Archived from the original on 5 September 2012. Retrieved 15 September 2012.
- ↑ "Cranbrook ward by-election". redbridge.gov.uk. Retrieved 20 July 2008.
- ↑ "London Borough Council Elections 6 May 2010" (PDF). London Datastore. Greater London Authority. Retrieved 7 March 2015.
- ↑ "2010 Local by Election Results". Archived from the original on 2 April 2015. Retrieved 18 May 2014.
- ↑ "British National Party take 'I Love London Campaign' to Redbridge | British National Party". Archived from the original on 4 November 2011. Retrieved 3 November 2011.
- ↑ "Aldborough Ward by-election results". Archived from the original on 6 April 2012. Retrieved 11 November 2011.