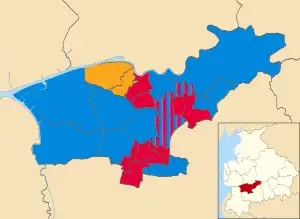
Map of the results of the 2019 South Ribble Borough Council election. Conservatives in blue, Labour in red and Liberal Democrats in yellow.
Local elections were held for South Ribble Borough Council on 2 May 2019, the same day as other 2019 United Kingdom local elections.[1] It resulted in the council going into no overall control (was previously Conservative controlled) with Labour taking charge after an agreement with the Liberal Democrats.[2][3]
Results summary
The results of the 2019 elections are summarised below.
| 2019 South Ribble Borough Council election | ||||||||||
|---|---|---|---|---|---|---|---|---|---|---|
| Party | This election | Full council | This election | |||||||
| Seats | Net | Seats % | Other | Total | Total % | Votes | Votes % | +/− | ||
| Conservative | 23 | 46 | 0 | 23 | 46 | 27,516 | 42.8 | |||
| Labour | 22 | 44 | 0 | 22 | 44 | 19,816 | 30.8 | |||
| Liberal Democrats | 5 | 10 | 0 | 5 | 10 | 9,391 | 14.6 | |||
| UKIP | 0 | 0.0 | 0 | 0 | 0.0 | 1,332 | 2.1 | |||
| Independent | 0 | 0.0 | 0 | 0 | 0 | 905 | 1.4 | |||
Ward results
Bamber Bridge East
| Party | Candidate | Votes | % | ±% | |
|---|---|---|---|---|---|
| Labour | Mick Higgins | 474 | 53.0 | ||
| Labour | Christine Melia | 433 | 48.4 | ||
| Conservative | Paul Watson | 303 | 33.9 | ||
| Conservative | Ashley Karmanski | 269 | 30.1 | ||
| UKIP | Marie Forshaw | 241 | 27.0 | ||
| Majority | |||||
| Turnout | 894 | 26.8 | |||
| Labour hold | Swing | ||||
| Labour hold | Swing | ||||
Bamber Bridge West
| Party | Candidate | Votes | % | ±% | |
|---|---|---|---|---|---|
| Labour | Paul Foster | 507 | 63.2 | ||
| Labour | Caleb Tomlinson | 440 | 54.9 | ||
| Conservative | Sheila Baxendale | 283 | 35.3 | ||
| Conservative | Paul Moon | 272 | 33.9 | ||
| Majority | |||||
| Turnout | 802 | 26.2 | |||
| Labour hold | Swing | ||||
| Labour hold | Swing | ||||
Broadfield
| Party | Candidate | Votes | % | ±% | |
|---|---|---|---|---|---|
| Labour Co-op | Mick Titherington | 824 | 77.5 | ||
| Labour Co-op | Matthew Tomlinson | 798 | 75.1 | ||
| Conservative | Jan Hamann | 180 | 16.9 | ||
| Conservative | Phil Hamann | 174 | 16.4 | ||
| Majority | |||||
| Turnout | 1,063 | 28.7 | |||
| Labour Co-op hold | Swing | ||||
| Labour Co-op hold | Swing | ||||
Broad Oak
| Party | Candidate | Votes | % | ±% | |
|---|---|---|---|---|---|
| Liberal Democrats | Harry Hancock | 1,008 | 66.8 | ||
| Liberal Democrats | Ange Turner | 909 | 60.2 | ||
| Conservative | Alistair Woollard | 362 | 24.0 | ||
| Conservative | Linda Woollard | 359 | 23.8 | ||
| Labour | Manson Osbourne | 233 | 15.4 | ||
| Majority | |||||
| Turnout | 1,510 | 42.9 | |||
| Liberal Democrats hold | Swing | ||||
| Liberal Democrats gain from Conservative | Swing | ||||
Buckshaw & Worden
| Party | Candidate | Votes | % | ±% | |
|---|---|---|---|---|---|
| Conservative | Caroline Moon | 828 | 64.0 | ||
| Conservative | Alan Ogilvie | 793 | 61.3 | ||
| Labour | Ruth Wynn | 438 | 33.8 | ||
| Labour | Dave Wynn | 419 | 32.4 | ||
| Majority | |||||
| Turnout | 1,294 | 34.6 | |||
| Conservative hold | Swing | ||||
| Conservative hold | Swing | ||||
Charnock
| Party | Candidate | Votes | % | ±% | |
|---|---|---|---|---|---|
| Labour | Ian Watkinson | 514 | 47.9 | ||
| Labour | Carol Wooldridge | 499 | 46.5 | ||
| Conservative | Joan Burrows | 455 | 42.4 | ||
| Conservative | George Ashcroft | 432 | 40.3 | ||
| Liberal Democrats | Helen Crewe | 106 | 9.9 | ||
| Majority | |||||
| Turnout | 1,072 | 36.7 | |||
| Labour hold | Swing | ||||
| Labour hold | Swing | ||||
Coupe Green & Gregson Lane
| Party | Candidate | Votes | % | ±% | |
|---|---|---|---|---|---|
| Conservative | Jim Marsh | 710 | 51.6 | ||
| Conservative | Sarah Whitaker | 679 | 49.3 | ||
| Labour | James Gleeson | 455 | 33.1 | ||
| Labour | Richard Burton | 405 | 29.4 | ||
| UKIP | Alastair Richardson | 257 | 18.7 | ||
| Majority | |||||
| Turnout | 1,376 | 40.1 | |||
| Conservative hold | Swing | ||||
| Conservative hold | Swing | ||||
Earnshaw Bridge
| Party | Candidate | Votes | % | ±% | |
|---|---|---|---|---|---|
| Labour | Bill Evans | 488 | 43.2 | ||
| Labour | Colin Sharples | 466 | 41.3 | ||
| Conservative | Susan Snape | 452 | 40.0 | ||
| Conservative | Andrew Ashton | 445 | 39.4 | ||
| Liberal Democrats | Carol Stunell | 157 | 13.9 | ||
| Liberal Democrats | Alastair Thomas | 131 | 11.6 | ||
| Majority | |||||
| Turnout | 1,129 | 32.4 | |||
| Labour hold | Swing | ||||
| Labour gain from Conservative | Swing | ||||
Farington East
| Party | Candidate | Votes | % | ±% | |
|---|---|---|---|---|---|
| Conservative | Paul Wharton | 511 | 52.1 | ||
| Labour | Jacky Alty | 362 | 36.9 | ||
| Conservative | David Moore | 353 | 36.0 | ||
| Labour | Kath Unsworth | 340 | 34.7 | ||
| Liberal Democrats | Katherine Hesketh-Holt | 153 | 15.6 | ||
| Liberal Democrats | Alexander Howarth | 68 | 6.9 | ||
| Majority | |||||
| Turnout | 980 | 30.5 | |||
| Conservative hold | Swing | ||||
| Labour hold | Swing | ||||
Farington West (delayed)
| Party | Candidate | Votes | % | ±% | |
|---|---|---|---|---|---|
| Conservative | Karen Walton | 536 | 59.8 | ||
| Conservative | Stephen Thurlbourn | 497 | |||
| Labour | Emma Buchanan | 246 | 27.5 | ||
| Labour | Ryan Hamilton | 171 | |||
| Liberal Democrats | Judith Davidson | 114 | 12.7 | ||
| Liberal Democrats | Alison Hesketh-Holt | 91 | |||
| Majority | |||||
| Turnout | |||||
| Conservative hold | Swing | ||||
| Conservative hold | Swing | ||||
Hoole
| Party | Candidate | Votes | % | ±% | |
|---|---|---|---|---|---|
| Conservative | David Suthers | 712 | 62.6 | ||
| Conservative | John Rainsbury | 627 | 55.1 | ||
| Labour | Mike Webster | 302 | 26.5 | ||
| Liberal Democrats | Timothy Young | 144 | 12.7 | ||
| Majority | |||||
| Turnout | 1,138 | 34.1 | |||
| Conservative hold | Swing | ||||
| Conservative hold | Swing | ||||
Howick & Priory
| Party | Candidate | Votes | % | ±% | |
|---|---|---|---|---|---|
| Liberal Democrats | David Howarth | 1,427 | 60.3 | ||
| Liberal Democrats | David Shaw | 1,202 | 50.8 | ||
| Liberal Democrats | Renee Blow | 1,090 | 46.1 | ||
| Independent | David Bird | 563 | 23.8 | ||
| Conservative | Mary Heaton | 529 | 22.4 | ||
| Conservative | Rebecca Noblet | 493 | 20.8 | ||
| Conservative | Julie Buttery | 458 | 19.4 | ||
| Labour | David Bennett | 415 | 17.5 | ||
| UKIP | John Carruthers | 189 | 8.0 | ||
| Majority | |||||
| Turnout | 2,365 | 43.1 | |||
| Liberal Democrats hold | Swing | ||||
| Liberal Democrats gain from Conservative | Swing | ||||
| Liberal Democrats gain from Conservative | Swing | ||||
Leyland Central
| Party | Candidate | Votes | % | ±% | |
|---|---|---|---|---|---|
| Labour | Aniela Bylinski Gelder | 601 | 49.3 | ||
| Labour | Derek Forrest | 571 | 46.8 | ||
| Conservative | Tony Green | 451 | 37.0 | ||
| Conservative | Robert Newsome | 427 | 35.0 | ||
| Liberal Democrats | Tracie Booth | 147 | 12.1 | ||
| Liberal Democrats | John Booth | 128 | 10.5 | ||
| Majority | |||||
| Turnout | 1,219 | 34.4 | |||
| Labour hold | Swing | ||||
| Labour hold | Swing | ||||
Longton & Hutton West
| Party | Candidate | Votes | % | ±% | |
|---|---|---|---|---|---|
| Conservative | Colin Coulton | 1,048 | 56.1 | ||
| Conservative | Colin Clark | 1,026 | 55.0 | ||
| Conservative | Jon Hesketh | 1,002 | 53.7 | ||
| Labour | Geoff Key | 357 | 19.1 | ||
| Liberal Democrats | David Moore | 329 | 17.6 | ||
| Liberal Democrats | Christopher Maloney | 295 | 15.8 | ||
| UKIP | Pat Taylor | 253 | 13.6 | ||
| UKIP | Walt Taylor | 229 | 12.3 | ||
| Majority | |||||
| Turnout | 1,867 | 40.5 | |||
| Conservative hold | Swing | ||||
| Conservative hold | Swing | ||||
| Conservative hold | Swing | ||||
Lostock Hall
| Party | Candidate | Votes | % | ±% | |
|---|---|---|---|---|---|
| Conservative | Joseph Hughes | 796 | 45.7 | ||
| Conservative | Jacqui Mort | 785 | 45.1 | ||
| Labour | Matthew Trafford | 737 | 42.3 | ||
| Conservative | Jeff Couperthwaite | 719 | 41.3 | ||
| Labour | Des Graham | 690 | 39.6 | ||
| Labour | Ann Rochester | 682 | 39.2 | ||
| Liberal Democrats | Helen Banks | 180 | 10.3 | ||
| Liberal Democrats | Peter Hubberstey | 159 | 9.1 | ||
| Liberal Democrats | James Banks | 147 | 8.4 | ||
| Majority | |||||
| Turnout | 1,742 | 34.0 | |||
| Conservative hold | Swing | ||||
| Conservative hold | Swing | ||||
| Labour gain from Conservative | Swing | ||||
Middleforth
| Party | Candidate | Votes | % | ±% | |
|---|---|---|---|---|---|
| Labour | Keith Martin | 869 | 49.3 | ||
| Labour | William Adams | 824 | 46.7 | ||
| Labour | James Flannery | 807 | 45.7 | ||
| Conservative | Paul Morris | 673 | 38.2 | ||
| Conservative | Anita Dunbar | 666 | 37.8 | ||
| Conservative | Frances Walker | 645 | 36.6 | ||
| Liberal Democrats | Marion Hancock | 286 | 16.2 | ||
| Majority | |||||
| Turnout | 1,764 | 32.4 | |||
| Labour hold | Swing | ||||
| Labour hold | Swing | ||||
| Labour hold | Swing | ||||
Moss Side
| Party | Candidate | Votes | % | ±% | |
|---|---|---|---|---|---|
| Conservative | Michael Green | 554 | 44.0 | ||
| Conservative | Mary Green | 537 | 42.7 | ||
| Labour | Lucienne Jackson | 333 | 26.5 | ||
| Liberal Democrats | Simon Thomson | 255 | 20.3 | ||
| Liberal Democrats | Paul Valentine | 208 | 16.5 | ||
| UKIP | Joan Wright | 163 | 13.0 | ||
| Majority | |||||
| Turnout | 1,258 | 40.8 | |||
| Conservative hold | Swing | ||||
| Conservative hold | Swing | ||||
New Longton & Hutton East
| Party | Candidate | Votes | % | ±% | |
|---|---|---|---|---|---|
| Conservative | Margaret Smith | 972 | 63.9 | ||
| Conservative | Phil Smith | 933 | 61.3 | ||
| Labour | Joe Giblin | 375 | 24.6 | ||
| Liberal Democrats | Mary Young | 262 | 17.2 | ||
| Liberal Democrats | Martin Cassell | 215 | 14.1 | ||
| Majority | |||||
| Turnout | 1,522 | 40.7 | |||
| Conservative hold | Swing | ||||
| Conservative hold | Swing | ||||
Samlesbury & Walton
| Party | Candidate | Votes | % | ±% | |
|---|---|---|---|---|---|
| Conservative | Barrie Yates | 657 | 67.3 | ||
| Conservative | Peter Mullineaux | 588 | |||
| Labour | Michael Darlington | 319 | 32.7 | ||
| Majority | |||||
| Turnout | |||||
| Conservative hold | Swing | ||||
| Conservative hold | Swing | ||||
Seven Stars
| Party | Candidate | Votes | % | ±% | |
|---|---|---|---|---|---|
| Labour | Jane Bell | 573 | 60.7 | ||
| Labour | Malcolm Donoghue | 484 | 51.3 | ||
| Conservative | Steve Booth | 374 | 39.6 | ||
| Conservative | Stephen Thurlbourn | 319 | 33.8 | ||
| Majority | |||||
| Turnout | 944 | 30.3 | |||
| Labour hold | Swing | ||||
| Labour hold | Swing | ||||
St. Ambrose
| Party | Candidate | Votes | % | ±% | |
|---|---|---|---|---|---|
| Labour | Susan Jones | 649 | 64.3 | ||
| Labour | Kenneth Jones | 596 | 59.1 | ||
| Conservative | Peter Aspinall | 232 | 23.0 | ||
| Conservative | Simon Casey | 187 | 18.5 | ||
| Liberal Democrats | James Pattison | 180 | 17.8 | ||
| Majority | |||||
| Turnout | 1,009 | 31.2 | |||
| Labour hold | Swing | ||||
| Labour hold | Swing | ||||
Walton-le-Dale East
| Party | Candidate | Votes | % | ±% | |
|---|---|---|---|---|---|
| Conservative | Carol Chisholm | 570 | 50.2 | ||
| Labour | Christopher Lomax | 550 | 48.4 | ||
| Conservative | Gareth Watson | 537 | 47.3 | ||
| Labour | Haydn Williams | 507 | 44.6 | ||
| Majority | |||||
| Turnout | 1,136 | 33.1 | |||
| Conservative hold | Swing | ||||
| Labour gain from Conservative | Swing | ||||
Walton-le-Dale West
| Party | Candidate | Votes | % | ±% | |
|---|---|---|---|---|---|
| Conservative | Damian Bretherton | 613 | 49.9 | ||
| Conservative | Matthew Campbell | 493 | 40.1 | ||
| Labour | Alex Watson | 363 | 29.5 | ||
| Independent | Mike Nelson | 342 | 27.8 | ||
| Majority | |||||
| Turnout | 1,229 | 37.1 | |||
| Conservative hold | Swing | ||||
| Conservative hold | Swing | ||||
By-elections
Bamber Bridge East
| Party | Candidate | Votes | % | ±% | |
|---|---|---|---|---|---|
| Labour | Patricia Hunter | 376 | 53.7 | +7.2 | |
| Conservative | Mathew Forshaw | 275 | 39.3 | +9.5 | |
| Green | Rachel Knowles | 49 | 7.0 | New | |
| Majority | 101 | 14.4 | |||
| Turnout | 700 | ||||
| Labour hold | Swing | ||||
References
- ↑ "South Ribble Borough Council Local Elections (borough election) 2019" (PDF). www.southribble.gov.uk. 2019. Archived from the original (PDF) on 12 October 2019. Retrieved 15 March 2020.
- ↑ "LOCAL ELECTIONS 2019: Who controls South Ribble now after indecisive vote?". Lancashire Evening Post. Retrieved 4 December 2022.
- ↑ "Leader for South Ribble council elected as Labour take control". Lancashire Evening Post. Retrieved 4 December 2022.
This article is issued from Wikipedia. The text is licensed under Creative Commons - Attribution - Sharealike. Additional terms may apply for the media files.