| |||||||||||||||||||||||||||||
All 47 seats to Teignbridge District Council[lower-alpha 1] 24 seats needed for a majority | |||||||||||||||||||||||||||||
|---|---|---|---|---|---|---|---|---|---|---|---|---|---|---|---|---|---|---|---|---|---|---|---|---|---|---|---|---|---|
| |||||||||||||||||||||||||||||
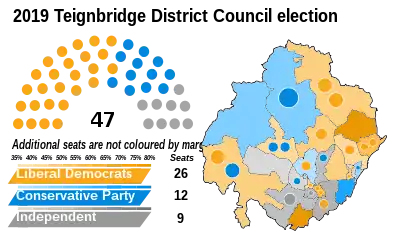 Results map by ward | |||||||||||||||||||||||||||||
| |||||||||||||||||||||||||||||
The 2019 Teignbridge District Council election took place on 2 May 2019 to elect members of Teignbridge District Council in England. At the election, the Liberal Democrats won control of the council.[1]
Summary
Election result
| 2019 Teignbridge District Council election[2][3] | ||||||||||
|---|---|---|---|---|---|---|---|---|---|---|
| Party | Candidates | Seats | Gains | Losses | Net gain/loss | Seats % | Votes % | Votes | +/− | |
| Liberal Democrats | 44 | 26 | N/A | N/A | 55.3 | 40.5 | 31,993 | +11.5 | ||
| Conservative | 46 | 12 | N/A | N/A | 25.5 | 29.6 | 23,346 | –8.2 | ||
| Independent | 22 | 9 | N/A | N/A | 19.1 | 13.5 | 10,679 | –1.9 | ||
| Labour | 29 | 0 | N/A | N/A | 0.0 | 10.0 | 7,898 | +5.3 | ||
| UKIP | 10 | 0 | N/A | N/A | 0.0 | 3.3 | 2,586 | –0.2 | ||
| Green | 6 | 0 | N/A | N/A | 0.0 | 2.9 | 2,311 | –6.3 | ||
Ward Results
Incumbents are denoted by an asterisk (*).
Ambrook
| Party | Candidate | Votes | % | ±% | |
|---|---|---|---|---|---|
| Independent | Richard Andrew Daws | 990 | 47.1 | ||
| Independent | Mary Elizabeth Colclough* | 848 | 40.3 | ||
| Liberal Democrats | Margaret Irene Crompton | 638 | 30.3 | ||
| Liberal Democrats | Tessa Carol Amies | 564 | 26.8 | ||
| Conservative | Dennis Esmond Smith* | 394 | 18.7 | ||
| Conservative | Richard Michael Butterworth | 335 | 15.9 | ||
| Majority | 210 | 10.0 | |||
| Turnout | 2,121 | 45.62 | |||
| Independent win (new seat) | |||||
| Independent win (new seat) | |||||
Ashburton & Buckfastleigh
| Party | Candidate | Votes | % | ±% | |
|---|---|---|---|---|---|
| Liberal Democrats | Frederick John Nutley* | 1,420 | 46.4 | ||
| Liberal Democrats | Huw William Cox | 996 | 32.5 | ||
| Conservative | Sarah Parker-Khan | 984 | 32.2 | ||
| Liberal Democrats | Jack Anthony Major | 960 | 31.4 | ||
| Labour | Andrew Timothy Stokes | 795 | 26.0 | ||
| Conservative | Charles Ernest Dennis* | 656 | 21.4 | ||
| Conservative | Shane Nigel Fleming | 563 | 18.4 | ||
| Labour | Anne Mary Goulborn | 530 | 17.3 | ||
| Independent | Philip Christopher Vogel | 497 | 16.2 | ||
| Labour | Patrick John Howard | 407 | 13.3 | ||
| Independent | Sylvia Lilian Phillips | 351 | 11.5 | ||
| Independent | Zoé Lynn Ellis | 177 | 5.8 | ||
| Independent | James Russell Birch Dennis | 132 | 4.3 | ||
| Majority | 24 | 0.8 | |||
| Turnout | 3,080 | 44.43 | |||
| Liberal Democrats win (new seat) | |||||
| Liberal Democrats win (new seat) | |||||
| Conservative win (new seat) | |||||
Bishopsteignton
| Party | Candidate | Votes | % | ±% | |
|---|---|---|---|---|---|
| Liberal Democrats | Andrew Kier MacGregor | 405 | 45.6 | ||
| Conservative | Nicholas Timothy Golder* | 376 | 42.3 | ||
| UKIP | Llewellyn Williams | 107 | 12.0 | ||
| Majority | 29 | 3.3 | |||
| Turnout | 901 | 40.55 | |||
| Liberal Democrats win (new seat) | |||||
Bovey
| Party | Candidate | Votes | % | ±% | |
|---|---|---|---|---|---|
| Liberal Democrats | Sally Angela Morgan | 1,083 | 40.8 | ||
| Conservative | Avril Joan Kerswell* | 1,070 | 40.3 | ||
| Conservative | George John Gribble* | 1,033 | 38.9 | ||
| Independent | Eoghan Eamon Kelly | 1,018 | 38.4 | ||
| Conservative | Martyn John Evans | 981 | 37.0 | ||
| Labour | Lisa Collette Robillard Webb | 641 | 24.2 | ||
| Labour | Susan Mary Honnor | 476 | 17.9 | ||
| Labour | Ian Hugh Wellens | 404 | 15.2 | ||
| Majority | 15 | 0.5 | |||
| Turnout | 2,682 | 42.63 | |||
| Liberal Democrats win (new seat) | |||||
| Conservative win (new seat) | |||||
| Conservative win (new seat) | |||||
Bradley
| Party | Candidate | Votes | % | ±% | |
|---|---|---|---|---|---|
| Independent | Michael John Hocking* | 590 | 37.0 | ||
| Conservative | Philip Andrew Bullivant* | 574 | 36.0 | ||
| Liberal Democrats | Richard David Jenks | 567 | 35.6 | ||
| Liberal Democrats | Brian Christopher Hayes | 533 | 33.4 | ||
| Conservative | Elizabeth Gorman Roberts | 376 | 23.6 | ||
| Labour | Jamie David Cook | 145 | 9.1 | ||
| Labour | Mark Alastair Langabeer | 117 | 7.3 | ||
| Majority | 7 | 0.4 | |||
| Turnout | 1,610 | 30.93 | |||
| Independent win (new seat) | |||||
| Conservative win (new seat) | |||||
Buckland & Milber
| Party | Candidate | Votes | % | ±% | |
|---|---|---|---|---|---|
| Liberal Democrats | Gordon Nicholas Hook* | 1,519 | 64.0 | ||
| Liberal Democrats | Colin Neil Parker* | 1,162 | 49.0 | ||
| Liberal Democrats | Christopher Richard Jenks | 1,023 | 43.1 | ||
| UKIP | Steven James Harvey | 416 | 17.5 | ||
| Conservative | Christopher Julian Coyle-Moore | 362 | 15.3 | ||
| UKIP | Stephen Jamie Witts | 353 | 14.9 | ||
| Conservative | Paul Reginald Furneaux Winsor* | 346 | 14.6 | ||
| Labour | Jane Haden | 284 | 12.0 | ||
| Conservative | Jonathan James Hodgson | 250 | 10.5 | ||
| Labour | James William Osben | 230 | 9.7 | ||
| Independent | Eloise Rokirilov | 202 | 8.5 | ||
| Labour | Rheanne Marie Osben | 196 | 8.3 | ||
| Majority | 607 | 25.6 | |||
| Turnout | 2,397 | 36.83 | |||
| Liberal Democrats win (new seat) | |||||
| Liberal Democrats win (new seat) | |||||
| Liberal Democrats win (new seat) | |||||
Bushell
| Party | Candidate | Votes | % | ±% | |
|---|---|---|---|---|---|
| Liberal Democrats | Jacqueline Ann Hook* | 639 | 44.8 | ||
| Liberal Democrats | Robert Henry Hayes* | 444 | 31.1 | ||
| Independent | Paul Kirk Field | 409 | 28.7 | ||
| Independent | Julie Ann Jones | 319 | 22.4 | ||
| Labour | Ryan William Hall | 245 | 17.2 | ||
| Conservative | Anthony Reginald Ballinger | 219 | 15.4 | ||
| Conservative | Simon Michael Walker | 183 | 12.8 | ||
| Labour | Pauline Angela Wynter | 178 | 12.5 | ||
| Majority | 35 | 2.4 | |||
| Turnout | 1,452 | 32.09 | |||
| Liberal Democrats win (new seat) | |||||
| Liberal Democrats win (new seat) | |||||
Chudleigh
| Party | Candidate | Votes | % | ±% | |
|---|---|---|---|---|---|
| Liberal Democrats | Richard Michael Keeling* | 918 | 46.6 | ||
| Liberal Democrats | Lorraine Margaret Evans* | 698 | 35.4 | ||
| Conservative | Georgina Sherwood | 658 | 33.4 | ||
| Green | Emily Joyce Simcock | 442 | 22.4 | ||
| Conservative | Christopher James Yeo | 422 | 21.4 | ||
| Labour | Janette Ann Parker | 233 | 11.8 | ||
| Labour | Joseph James Blurton | 208 | 10.6 | ||
| Majority | 24 | 0.8 | |||
| Turnout | 2,005 | 42.93 | |||
| Liberal Democrats win (new seat) | |||||
| Liberal Democrats win (new seat) | |||||
College
| Party | Candidate | Votes | % | ±% | |
|---|---|---|---|---|---|
| Independent | Janet Bradford | 743 | 46.9 | ||
| Independent | Liam David Parker | 596 | 37.6 | ||
| Liberal Democrats | Michael John Pilkington* | 388 | 24.5 | ||
| Liberal Democrats | Michael Douglas Joyce | 338 | 21.3 | ||
| Independent | David Howe | 241 | 15.2 | ||
| Labour | Oliver Giddings | 168 | 10.6 | ||
| Conservative | John Trevor Thomas Phillips | 159 | 10.0 | ||
| Conservative | Nicholas Paul Yabsley | 146 | 9.2 | ||
| Labour | Paul David Wynter | 133 | 8.4 | ||
| UKIP | John Steven Gynn | 102 | 6.4 | ||
| Majority | 208 | 13.1 | |||
| Turnout | 1,592 | 39.21 | |||
| Independent win (new seat) | |||||
| Independent win (new seat) | |||||
Dawlish North East
| Party | Candidate | Votes | % | ±% | |
|---|---|---|---|---|---|
| Liberal Democrats | John Martin Charles Wrigley* | 1,406 | 59.8 | ||
| Liberal Democrats | Linda Petherick | 1,173 | 49.9 | ||
| Liberal Democrats | Linda Jean Goodman-Bradbury | 982 | 41.8 | ||
| Conservative | Lisa Eugene Mayne* | 596 | 25.4 | ||
| Green | Christina Gabriel Humphries | 529 | 22.5 | ||
| Conservative | Kevin Peter Parsons | 485 | 20.6 | ||
| Conservative | Noel Nickless | 445 | 18.9 | ||
| UKIP | Judith Ellen Wood | 409 | 17.4 | ||
| Majority | 386 | 16.4 | |||
| Turnout | 2,374 | 35.27 | |||
| Liberal Democrats win (new seat) | |||||
| Liberal Democrats win (new seat) | |||||
| Liberal Democrats win (new seat) | |||||
Dawlish South West
| Party | Candidate | Votes | % | ±% | |
|---|---|---|---|---|---|
| Liberal Democrats | John Robert Petherick | 722 | 41.3 | ||
| Liberal Democrats | Gary William Taylor | 702 | 40.2 | ||
| Conservative | Rosalind Mary Prowse* | 561 | 32.1 | ||
| Conservative | Humphrey Hawkey Clemens* | 518 | 29.7 | ||
| Green | John Patrick Crawford Watson | 405 | 23.2 | ||
| UKIP | Douglas Reay Waring Wood | 277 | 15.9 | ||
| Majority | 141 | 8.1 | |||
| Turnout | 1,763 | 36.86 | |||
| Liberal Democrats win (new seat) | |||||
| Liberal Democrats win (new seat) | |||||
Haytor
| Party | Candidate | Votes | % | ±% | |
|---|---|---|---|---|---|
| Independent | Adrian Patch | 376 | 37.5 | ||
| Independent | Robert Howard Steemson | 321 | 32.0 | ||
| Conservative | Jeremy Owen Christophers* | 222 | 22.1 | ||
| Labour | Philip Cunningham | 57 | 5.7 | ||
| Independent | Jessica Mai Hodge | 27 | 2.7 | ||
| Majority | 55 | 5.5 | |||
| Turnout | 1,013 | 49.10 | |||
| Independent win (new seat) | |||||
Ipplepen
| Party | Candidate | Votes | % | ±% | |
|---|---|---|---|---|---|
| Liberal Democrats | John Peter Alistair Dewhirst* | 786 | 80.0 | ||
| Conservative | Lloyd Roland Fursdon | 197 | 20.0 | ||
| Majority | 589 | 60.0 | |||
| Turnout | 998 | 48.45 | |||
| Liberal Democrats win (new seat) | |||||
Kenn Valley
| Party | Candidate | Votes | % | ±% | |
|---|---|---|---|---|---|
| Liberal Democrats | Charles John Sinclair Nuttall | 1,258 | 49.1 | ||
| Liberal Democrats | Nicholas Andrew Swain | 1,194 | 46.6 | ||
| Liberal Democrats | Alison Grace Foden | 1,133 | 44.2 | ||
| Conservative | Kevin Andrew Lake* | 1,058 | 41.3 | ||
| Conservative | John Robert Goodey* | 1,006 | 39.3 | ||
| Conservative | Adrian Lewis Wood | 890 | 34.7 | ||
| Labour | Sarah Elizabeth Krys | 288 | 11.2 | ||
| Labour | Anthony Krys | 232 | 9.1 | ||
| Majority | 75 | 2.9 | |||
| Turnout | 2,608 | 40.15 | |||
| Liberal Democrats win (new seat) | |||||
| Liberal Democrats win (new seat) | |||||
| Liberal Democrats win (new seat) | |||||
Kenton & Starcross
| Party | Candidate | Votes | % | ±% | |
|---|---|---|---|---|---|
| Liberal Democrats | Alan Michael Connett* | 848 | 77.7 | ||
| Green | Megan Kathryn Debenham | 149 | 13.7 | ||
| Conservative | Lucille Mary Michelle Baker | 93 | 8.5 | ||
| Majority | 699 | 64.0 | |||
| Turnout | 1,094 | 46.65 | |||
| Liberal Democrats win (new seat) | |||||
Kerswell-with-Combe
| Party | Candidate | Votes | % | ±% | |
|---|---|---|---|---|---|
| Independent | Michael John Haines* | 917 | 52.2 | ||
| Liberal Democrats | Sheila Mary Cook* | 704 | 40.1 | ||
| Conservative | Andrew Martin Thirkell Hartley | 570 | 32.5 | ||
| Liberal Democrats | Cameron Charles Whitford | 533 | 30.4 | ||
| Conservative | Fiona Grace Muddeman | 251 | 14.3 | ||
| Majority | 134 | 7.6 | |||
| Turnout | 1,765 | 36.98 | |||
| Independent win (new seat) | |||||
| Liberal Democrats win (new seat) | |||||
Kingsteignton East
| Party | Candidate | Votes | % | ±% | |
|---|---|---|---|---|---|
| Independent | Beryl Austen* | 663 | 46.7 | ||
| Conservative | Ronald Peart* | 520 | 36.6 | ||
| Liberal Democrats | Marie Chadwick | 491 | 34.6 | ||
| Green | Jennifer Mary Osborne | 314 | 22.1 | ||
| Conservative | Robert James Perry | 252 | 17.8 | ||
| Liberal Democrats | David John Corney-Walker | 183 | 12.9 | ||
| Majority | 29 | 2.0 | |||
| Turnout | 1,427 | 28.67 | |||
| Independent win (new seat) | |||||
| Conservative win (new seat) | |||||
Kingsteignton West
| Party | Candidate | Votes | % | ±% | |
|---|---|---|---|---|---|
| Conservative | William Herbert Percy Thorne* | 445 | 36.4 | ||
| Liberal Democrats | David William Rollason* | 443 | 36.3 | ||
| Independent | Antony Darryl David Dempster | 422 | 34.6 | ||
| Liberal Democrats | Philip Chadwick | 367 | 30.1 | ||
| UKIP | Jacqueline Mary Hooper | 265 | 21.7 | ||
| Conservative | Sam Morfey | 203 | 16.6 | ||
| Majority | 21 | 1.7 | |||
| Turnout | 1,223 | 27.50 | |||
| Conservative win (new seat) | |||||
| Liberal Democrats win (new seat) | |||||
Moretonhampstead
| Party | Candidate | Votes | % | ±% | |
|---|---|---|---|---|---|
| Conservative | Michael Harrold Jeffery* | 537 | 48.1 | ||
| Liberal Democrats | John Farrand-Rogers | 422 | 37.8 | ||
| Labour | Brian McAuley | 157 | 14.1 | ||
| Majority | 115 | 10.3 | |||
| Turnout | 1,145 | 47.12 | |||
| Conservative win (new seat) | |||||
Shaldon & Stokeinteignhead
| Party | Candidate | Votes | % | ±% | |
|---|---|---|---|---|---|
| Conservative | Christopher Stuart Clarance* | 663 | 65.5 | ||
| Liberal Democrats | Julie Mary Gregory | 284 | 28.1 | ||
| Labour | Colin John Baigent | 65 | 6.4 | ||
| Majority | 115 | 10.3 | |||
| Turnout | 1,032 | 50.17 | |||
| Conservative win (new seat) | |||||
Teign Valley
| Party | Candidate | Votes | % | ±% | |
|---|---|---|---|---|---|
| Conservative | Stephen John Kinross Purser | 841 | 49.9 | ||
| Conservative | Terence Charles Mark Tume | 667 | 39.6 | ||
| Liberal Democrats | Briony Falch | 589 | 34.9 | ||
| Green | Mary Anne McFarlane | 472 | 28.0 | ||
| Liberal Democrats | Karen Tracy Chaplin | 361 | 21.4 | ||
| Labour | Michael Edwin Megee | 249 | 14.8 | ||
| Majority | 78 | 4.7 | |||
| Turnout | 1,722 | 42.69 | |||
| Conservative win (new seat) | |||||
| Conservative win (new seat) | |||||
Teignmouth Central
| Party | Candidate | Votes | % | ±% | |
|---|---|---|---|---|---|
| Independent | Jacqueline Orme* | 634 | 39.1 | ||
| Liberal Democrats | Alison Margaret Eden* | 589 | 36.3 | ||
| Liberal Democrats | Peter Malcolm Williams | 552 | 34.1 | ||
| Conservative | Keith Ronald Underhill | 422 | 26.0 | ||
| Labour | Lillian Georgina Jean Chasteau | 278 | 17.1 | ||
| UKIP | David Anthony Gunn | 237 | 14.6 | ||
| Labour | Noah Steven Nelson Chasteau | 236 | 14.6 | ||
| Majority | 37 | 2.2 | |||
| Turnout | 1,639 | 37.88 | |||
| Independent win (new seat) | |||||
| Liberal Democrats win (new seat) | |||||
Teignmouth East
| Party | Candidate | Votes | % | ±% | |
|---|---|---|---|---|---|
| Conservative | Robert Julius Phipps | 705 | 42.2 | ||
| Conservative | Ella Sylvia Russell* | 625 | 37.4 | ||
| Liberal Democrats | Catriona Thomas | 467 | 27.9 | ||
| Liberal Democrats | Brian Leslie Dennis Wright | 466 | 27.9 | ||
| UKIP | Christopher Charles Whitlock | 246 | 14.7 | ||
| Labour | Marilyn Anne Warrener | 227 | 13.6 | ||
| Labour | Donald Bruce Mattock | 211 | 12.6 | ||
| Majority | 158 | 4.7 | |||
| Turnout | 1,709 | 43.07 | |||
| Conservative win (new seat) | |||||
| Conservative win (new seat) | |||||
Teignmouth West
| Party | Candidate | Votes | % | ±% | |
|---|---|---|---|---|---|
| Liberal Democrats | David Nicholas Cox* | 649 | 49.7 | ||
| Liberal Democrats | Nina Susan Jeffries | 394 | 30.2 | ||
| Conservative | David Andrew Matthews* | 291 | 22.3 | ||
| Labour | Jacqueline Mary Jackson | 270 | 20.7 | ||
| Labour | Jeffrey Lee Pocock | 238 | 18.2 | ||
| Independent | Colin Joseph Authers | 206 | 15.8 | ||
| Conservative | June Green | 198 | 15.2 | ||
| UKIP | Geraldine Williams | 174 | 13.3 | ||
| Majority | 35 | 2.4 | |||
| Turnout | 1,314 | 33.63 | |||
| Liberal Democrats win (new seat) | |||||
| Liberal Democrats win (new seat) | |||||
Notes
- ↑ Ward boundaries changed, increasing the number of seats from 46 to 47
References
- ↑ "Election Results: Lib Dems make gains across Devon". Retrieved 16 May 2019.
- ↑ "Latest updates and results". Retrieved 21 May 2019.
- ↑ "Teignbridge District Council". BBC News. Retrieved 21 August 2022.
This article is issued from Wikipedia. The text is licensed under Creative Commons - Attribution - Sharealike. Additional terms may apply for the media files.