The 2021 Exeter City Council election took place on 6 May 2021 to elect the members of Exeter City Council in Devon, England.[1] This was on the same day as other local elections. Two candidates were elected to the Mincinglake and Whipton ward due to a by-election taking place the same day following the death of a Councillor some months earlier.
| |||||||||||||||||||||||||||||||||
13 of 39 seats (One Third) to Exeter City Council 20 seats needed for a majority | |||||||||||||||||||||||||||||||||
|---|---|---|---|---|---|---|---|---|---|---|---|---|---|---|---|---|---|---|---|---|---|---|---|---|---|---|---|---|---|---|---|---|---|
| |||||||||||||||||||||||||||||||||
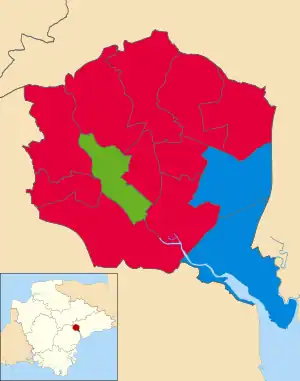 Map showing the results of the 2021 Exeter City Council elections by ward. Red shows Labour seats, blue shows the Conservatives, green shows the Green Party. | |||||||||||||||||||||||||||||||||
Results summary
| 2021 Exeter City Council election | ||||||||||
|---|---|---|---|---|---|---|---|---|---|---|
| Party | This election | Full council | This election | |||||||
| Seats | Net | Seats % | Other | Total | Total % | Votes | Votes % | +/− | ||
| Labour | 11 | 78.6 | 17 | 28 | 71.8 | 16,756 | 44.4 | +8.3 | ||
| Conservative | 2 | 14.3 | 4 | 6 | 15.4 | 11,381 | 30.1 | +3.7 | ||
| Green | 1 | 7.1 | 1 | 2 | 5.1 | 5,947 | 15.7 | -2.1 | ||
| Liberal Democrats | 0 | 0.0 | 2 | 2 | 5.1 | 3,160 | 8.4 | -3.2 | ||
| Independent | 0 | 0.0 | 1 | 1 | 2.6 | 231 | 0.6 | -3.9 | ||
| Women's Equality | 0 | 0.0 | 0 | 0 | 0.0 | 188 | 0.5 | +0.3 | ||
| For Britain | 0 | 0.0 | 0 | 0 | 0.0 | 118 | 0.3 | ±0.0 | ||
Ward results
Alphington
| Party | Candidate | Votes | % | ±% | |
|---|---|---|---|---|---|
| Labour | Steve Warwick | 1,157 | 43.5 | +6.3 | |
| Conservative | Katherine New | 1,064 | 40.0 | +10.7 | |
| Green | Julyan Levy | 248 | 9.3 | -7.0 | |
| Liberal Democrats | Rod Ruffle | 191 | 7.2 | -1.1 | |
| Majority | 93 | 3.5 | -4.4 | ||
| Turnout | 2,684 | 41.3 | +3.8 | ||
| Labour hold | Swing | ||||
Duryard and St. James
| Party | Candidate | Votes | % | ±% | |
|---|---|---|---|---|---|
| Labour | Martin Pearce | 980 | 39.8 | +14.4 | |
| Liberal Democrats | Will Aczel | 795 | 32.3 | -1.6 | |
| Conservative | Aric Gilinsky | 497 | 20.2 | -5.5 | |
| Women's Equality | Bea Gare | 188 | 7.6 | +4.8 | |
| Majority | 185 | 7.5 | |||
| Turnout | 2,481 | 32.5 | -2.3 | ||
| Labour hold | Swing | ||||
Exwick
| Party | Candidate | Votes | % | ±% | |
|---|---|---|---|---|---|
| Labour Co-op | Philip Bialyk | 1,280 | 50.6 | +6.1 | |
| Conservative | Kayleigh Luscombe | 792 | 31.3 | +6.5 | |
| Green | Jamie Lynde | 353 | 13.9 | -0.9 | |
| Liberal Democrats | Maya Skelton | 107 | 4.2 | +1.1 | |
| Majority | 488 | 19.3 | -0.4 | ||
| Turnout | 2,559 | 35.0 | +3.3 | ||
| Labour Co-op hold | Swing | ||||
Heavitree
| Party | Candidate | Votes | % | ±% | |
|---|---|---|---|---|---|
| Labour | Barbara Denning | 1,255 | 39.0 | -3.7 | |
| Green | Catherine Rees | 1,239 | 38.5 | +11.3 | |
| Conservative | Alfie Carlisle | 725 | 22.5 | +1.4 | |
| Majority | 16 | 0.5 | -15.0 | ||
| Turnout | 3,235 | 46.7 | +6.7 | ||
| Labour hold | Swing | ||||
Mincinglake and Whipton
| Party | Candidate | Votes | % | ±% | |
|---|---|---|---|---|---|
| Labour | Emma Morse | 1,059 | 45.5 | -2.6 | |
| Labour | Naima Allcock | 1,052 | 45.2 | -2.9 | |
| Conservative | Edward Barradell | 682 | 29.3 | +13.2 | |
| Conservative | Joseph Straker | 513 | 22.0 | +5.9 | |
| Green | David Barker-Hahlo | 383 | 16.4 | +3.8 | |
| Liberal Democrats | Felix Brett | 160 | 6.9 | +1.0 | |
| Turnout | 2,329 | 34.4 | +4.9 | ||
| Labour hold | Swing | ||||
| Labour hold | Swing | ||||
Newtown and St. Leonard's
| Party | Candidate | Votes | % | ±% | |
|---|---|---|---|---|---|
| Labour | Richard Branston | 1,388 | 44.7 | +5.6 | |
| Green | Dan Grey | 1,262 | 40.7 | New | |
| Conservative | George Smith | 452 | 14.6 | +2.4 | |
| Majority | 126 | 4.0 | |||
| Turnout | 3,130 | 42.2 | +3.1 | ||
| Labour hold | Swing | ||||
Pennsylvania
| Party | Candidate | Votes | % | ±% | |
|---|---|---|---|---|---|
| Labour | Zion Lights | 1,655 | 52.1 | +13.1 | |
| Conservative | Samuel Barnett | 895 | 28.2 | -3.1 | |
| Liberal Democrats | Nigel Williams | 625 | 19.7 | +14.0 | |
| Majority | 760 | 23.9 | -16.1 | ||
| Turnout | 3,207 | 40.8 | +3.6 | ||
| Labour hold | Swing | ||||
Pinhoe
| Party | Candidate | Votes | % | ±% | |
|---|---|---|---|---|---|
| Labour | David Harvey | 1,310 | 49.0 | +10.6 | |
| Conservative | John Harvey | 978 | 36.6 | -1.2 | |
| Green | Lynn Wetenhall | 237 | 8.9 | -0.5 | |
| Liberal Democrats | Henry Mayall | 148 | 5.5 | +1.9 | |
| Majority | 332 | 12.4 | +11.8 | ||
| Turnout | 2,690 | 40.1 | +1.8 | ||
| Labour hold | Swing | ||||
Priory
| Party | Candidate | Votes | % | ±% | |
|---|---|---|---|---|---|
| Labour | Alys Martin | 1,243 | 50.1 | +14.7 | |
| Conservative | James Taghdissian | 824 | 33.2 | +5.9 | |
| Green | Charles Russett | 303 | 12.2 | -2.9 | |
| Liberal Democrats | Joel Punwani | 111 | 4.5 | -5.2 | |
| Majority | 419 | 16.9 | |||
| Turnout | 2,502 | 37.7 | +0.9 | ||
| Labour hold | Swing | ||||
St. David's
| Party | Candidate | Votes | % | ±% | |
|---|---|---|---|---|---|
| Green | Amy Sparling | 1,276 | 45.4 | -9.5 | |
| Labour | Carol Whitton | 1,063 | 37.8 | +7.7 | |
| Conservative | Arden Foster-Spinks | 472 | 16.8 | +6.6 | |
| Majority | 213 | 7.6 | N/A | ||
| Turnout | 2,829 | 37.5 | +1.9 | ||
| Green gain from Labour | Swing | ||||
St. Loye's
| Party | Candidate | Votes | % | ±% | |
|---|---|---|---|---|---|
| Conservative | Anne Jobson | 1,234 | 46.6 | -1.0 | |
| Labour | Olwen Foggin | 1,004 | 37.9 | +14.9 | |
| Green | Jack Eade | 258 | 9.7 | +1.1 | |
| Liberal Democrats | Kris Mears | 119 | 4.5 | -4.1 | |
| For Britain | Debbie Frayne | 32 | 1.2 | N/A | |
| Majority | 230 | 8.7 | -15.9 | ||
| Turnout | 2,662 | 38.0 | +3.7 | ||
| Conservative hold | Swing | ||||
St. Thomas
| Party | Candidate | Votes | % | ±% | |
|---|---|---|---|---|---|
| Labour Co-op | Rob Hannaford | 1,404 | 46.8 | +5.8 | |
| Liberal Democrats | Adrian Fullam | 661 | 22.1 | +7.6 | |
| Conservative | Ashley Carr | 615 | 20.5 | +2.1 | |
| Independent | Paul Mouland | 231 | 7.7 | +2.9 | |
| For Britain | Frankie Rufolo | 86 | 2.9 | -1.4 | |
| Majority | 743 | 24.7 | |||
| Turnout | 3,021 | 40.7 | +5.3 | ||
| Labour Co-op hold | Swing | ||||
Topsham
| Party | Candidate | Votes | % | ±% | |
|---|---|---|---|---|---|
| Conservative | Andrew Leadbetter | 1,638 | 51.6 | +4.3 | |
| Labour | Ivan Jordan | 906 | 28.5 | -1.4 | |
| Green | Jon Mills | 388 | 12.2 | -5.4 | |
| Liberal Democrats | Christine Campion | 243 | 7.7 | +2.4 | |
| Majority | 732 | 23.1 | +5.7 | ||
| Turnout | 3,194 | 42.9 | +4.9 | ||
| Conservative hold | Swing | ||||
References
- ↑ "2021 City Elections - Exeter City Council". Exeter City Council website. Archived from the original on 18 May 2021. Retrieved 18 May 2021.
This article is issued from Wikipedia. The text is licensed under Creative Commons - Attribution - Sharealike. Additional terms may apply for the media files.