| |||||||||||||||||||||||||||||||||||||||||||||||||||||||||||
21 out of 40 seats to Cheltenham Borough Council 21 seats needed for a majority | |||||||||||||||||||||||||||||||||||||||||||||||||||||||||||
|---|---|---|---|---|---|---|---|---|---|---|---|---|---|---|---|---|---|---|---|---|---|---|---|---|---|---|---|---|---|---|---|---|---|---|---|---|---|---|---|---|---|---|---|---|---|---|---|---|---|---|---|---|---|---|---|---|---|---|---|
| |||||||||||||||||||||||||||||||||||||||||||||||||||||||||||
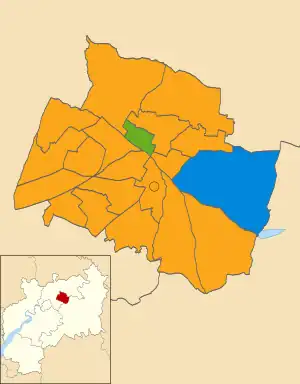 Winner of each seat at the 2022 Cheltenham Borough Council election | |||||||||||||||||||||||||||||||||||||||||||||||||||||||||||
| |||||||||||||||||||||||||||||||||||||||||||||||||||||||||||
The 2022 Cheltenham Borough Council elections took place on 5 May 2022 to elect members of Cheltenham Borough Council in Gloucestershire, England. Half of the council was up for election.[1]
Results
35,574
| 2022 Cheltenham Borough Council election | ||||||||||
|---|---|---|---|---|---|---|---|---|---|---|
| Party | This election | Full council | This election | |||||||
| Seats | Net | Seats % | Other | Total | Total % | Votes | Votes % | +/− | ||
| Liberal Democrats | 18 | 85.7 | 13 | 31 | 77.5 | 19,595 | 55.1 | +12.5 | ||
| Conservative | 1 | 4.8 | 5 | 6 | 15.0 | 9,867 | 27.7 | -9.8 | ||
| PAB | 1 | 4.8 | 1 | 2 | 5.0 | 996 | 2.8 | -0.6 | ||
| Green | 1 | 4.8 | 0 | 1 | 2.5 | 4,028 | 11.3 | +0.3 | ||
| Labour | 0 | 0.0 | 0 | 0 | 0.0 | 1,030 | 2.9 | -2.5 | ||
| Reform UK | 0 | 0.0 | 0 | 0 | 0.0 | 47 | 0.1 | N/A | ||
| TUSC | 0 | 0.0 | 0 | 0 | 0.0 | 11 | 0.0 | -0.1 | ||
| Party | Previous council | New council | +/- | |
|---|---|---|---|---|
| Liberal Democrats | 31 | 31 | 0 | |
| Conservatives | 7 | 6 | -1 | |
| People Against Bureaucracy | 2 | 2 | 0 | |
| Green Party | 0 | 1 | +1 | |
| Total | 40 | 40 | ||
Ward results
Incumbent councillors are denoted by an asterisk (*) [2]
All Saints
| Party | Candidate | Votes | % | ±% | |
|---|---|---|---|---|---|
| Liberal Democrats | Izaac Augustus Tailford | 1,048 | 62.9 | +16.1 | |
| Conservative | Peter Christensen | 362 | 21.7 | -8.1 | |
| Green | Stephen West | 145 | 8.7 | -7.2 | |
| Labour | Isobel Amy Laing | 112 | 6.7 | -0.9 | |
| Majority | 686 | 41.2 | |||
| Turnout | 1,667 | 38.1 | -1.9 | ||
| Liberal Democrats hold | Swing | ||||
Battledown
| Party | Candidate | Votes | % | ±% | |
|---|---|---|---|---|---|
| Conservative | Matt Babbage* | 893 | 46.4 | +0.1 | |
| Liberal Democrats | Ed Chidley | 785 | 40.8 | +1.7 | |
| Green | Karen Celia Wilson | 246 | 12.8 | +4.3 | |
| Majority | 108 | 5.6 | |||
| Turnout | 1,924 | 40.0 | -6.0 | ||
| Conservative hold | Swing | ||||
Benhall & The Reddings
| Party | Candidate | Votes | % | ±% | |
|---|---|---|---|---|---|
| Liberal Democrats | Nigel Charles Britter* | 1,218 | 66.6 | +15.0 | |
| Conservative | Michael David Scott Evans | 452 | 24.7 | -13.1 | |
| Green | Sarah Jane Field | 158 | 8.6 | +1.1 | |
| Majority | 766 | 41.9 | |||
| Turnout | 1,828 | 46.3 | -4.7 | ||
| Liberal Democrats hold | Swing | ||||
Charlton Kings
| Party | Candidate | Votes | % | ±% | |
|---|---|---|---|---|---|
| Liberal Democrats | Angie Boyes* | 1,222 | 54.7 | +8.3 | |
| Conservative | Jake Wilson | 743 | 33.3 | -5.6 | |
| Green | Daniel Joseph Willey | 185 | 8.3 | -2.2 | |
| Labour | Caroline Adele Gavin | 84 | 3.8 | -0.4 | |
| Majority | 479 | 21.4 | |||
| Turnout | 2,234 | 50.2 | +0.2 | ||
| Liberal Democrats hold | Swing | ||||
Charlton Park
| Party | Candidate | Votes | % | ±% | |
|---|---|---|---|---|---|
| Liberal Democrats | Paul Richard Baker* | 1,265 | 58.8 | +12.0 | |
| Conservative | Georgie Bass | 726 | 33.8 | -9.2 | |
| Green | Sharon Lorna Wallington | 160 | 7.4 | +0.5 | |
| Majority | 539 | 25.1 | |||
| Turnout | 2,151 | 54.7 | -3.3 | ||
| Liberal Democrats hold | Swing | ||||
College
| Party | Candidate | Votes | % | ±% | |
|---|---|---|---|---|---|
| Liberal Democrats | Garth Wallington Barnes* | 1,060 | 56.5 | +5.5 | |
| Liberal Democrats | Iain Andrew Paterson Dobie** | 1,019 | 54.3 | +3.3 | |
| Conservative | Rich Newman | 418 | 22.3 | -5.6 | |
| Conservative | Kenneth Anthony Pollock | 397 | 21.2 | -6.7 | |
| Green | Elizabeth Johnson | 303 | 16.2 | +1.0 | |
| Green | Connor Lewis Auker-Howlett | 192 | 10.2 | -5.0 | |
| Labour | Kevin Michael Boyle | 138 | 7.4 | +1.5 | |
| Reform UK | Steven Thomas | 47 | 2.5 | N/A | |
| Majority | 601 | 32.0 | |||
| Turnout | 1,875 | 42.3 | |||
| Liberal Democrats hold | Swing | ||||
| Liberal Democrats hold | Swing | ||||
Iain Dobie was a sitting councillor for Warden Hill ward.
Hesters Way
| Party | Candidate | Votes | % | ±% | |
|---|---|---|---|---|---|
| Liberal Democrats | Simon Albert Wheeler* | 632 | 51.7 | +6.3 | |
| Conservative | Jerry Forrest | 361 | 29.5 | -8.3 | |
| Labour | John Malcolm Bride | 115 | 9.4 | +1.7 | |
| Green | Adrian Becker | 104 | 8.5 | -0.2 | |
| TUSC | Samuel Jacob Coxson | 11 | 0.9 | +0.4 | |
| Majority | 271 | 22.2 | |||
| Turnout | 1,223 | 24.3 | -3.7 | ||
| Liberal Democrats hold | Swing | ||||
Lansdown
| Party | Candidate | Votes | % | ±% | |
|---|---|---|---|---|---|
| Liberal Democrats | Glenn Andrews | 829 | 51.9 | +16.3 | |
| Conservative | Chris Mason* | 604 | 37.8 | -7.3 | |
| Green | Steve Bell | 164 | 10.3 | +2.6 | |
| Majority | 225 | 14.1 | |||
| Turnout | 1,597 | 37.9 | -4.1 | ||
| Liberal Democrats gain from Conservative | Swing | ||||
Leckhampton
| Party | Candidate | Votes | % | ±% | |
|---|---|---|---|---|---|
| Liberal Democrats | Martin Charles Horwood* | 1,446 | 60.8 | +27.7 | |
| Conservative | Teresa Anne Prothero | 547 | 23.0 | -20.9 | |
| Green | Peter Robert Frings | 387 | 16.3 | -6.7 | |
| Majority | 899 | 37.8 | |||
| Turnout | 2,380 | 54.5 | -4.5 | ||
| Liberal Democrats hold | Swing | ||||
Oakley
| Party | Candidate | Votes | % | ±% | |
|---|---|---|---|---|---|
| Liberal Democrats | Max Wilkinson* | 775 | 63.5 | +15.4 | |
| Conservative | James Alan Robert Bass | 249 | 20.4 | -13.0 | |
| Labour | Michael Jarvis | 110 | 9.0 | -0.8 | |
| Green | Carl Anthony Parker | 87 | 7.1 | -1.5 | |
| Majority | 526 | 43.1 | |||
| Turnout | 1,221 | 28.3 | -0.7 | ||
| Liberal Democrats hold | Swing | ||||
Park
| Party | Candidate | Votes | % | ±% | |
|---|---|---|---|---|---|
| Liberal Democrats | Jacqueline Ann Chelin | 1,304 | 53.4 | +15.7 | |
| Conservative | David George Reed | 926 | 37.9 | -11.7 | |
| Green | Catherine Sunita Lyon Leggett | 211 | 8.6 | +0.3 | |
| Majority | 378 | 15.5 | |||
| Turnout | 2,441 | 48.9 | -4.1 | ||
| Liberal Democrats hold | Swing | ||||
Pittville
| Party | Candidate | Votes | % | ±% | |
|---|---|---|---|---|---|
| Liberal Democrats | Julian Charles George Tooke | 1,097 | 52.7 | +19.5 | |
| Conservative | Jonathan Edward Beeston | 663 | 31.8 | -16.5 | |
| Green | Daniel Wilson | 322 | 15.5 | +4.7 | |
| Majority | 434 | 20.8 | |||
| Turnout | 2,082 | 42.4 | -1.6 | ||
| Liberal Democrats hold | Swing | ||||
Prestbury
| Party | Candidate | Votes | % | ±% | |
|---|---|---|---|---|---|
| PAB | John Payne* | 996 | 45.7 | -4.3 | |
| Conservative | Laura Elizabeth Haley | 466 | 21.4 | -8.9 | |
| Green | Dan Taylor | 398 | 18.3 | N/A | |
| Liberal Democrats | Ben Ingram | 318 | 14.6 | -5.1 | |
| Majority | 530 | 24.3 | |||
| Turnout | 2,178 | 44.6 | -1.4 | ||
| PAB hold | Swing | ||||
Springbank
| Party | Candidate | Votes | % | ±% | |
|---|---|---|---|---|---|
| Liberal Democrats | Peter Jeremy Jeffries* | 1,035 | 77.2 | +24.3 | |
| Conservative | Paul Robert Simons | 191 | 14.3 | -16.0 | |
| Green | Stephen John Bear | 114 | 8.5 | +1.1 | |
| Majority | 844 | 63.0 | |||
| Turnout | 1,340 | 26.3 | -1.7 | ||
| Liberal Democrats hold | Swing | ||||
St Mark's
| Party | Candidate | Votes | % | ±% | |
|---|---|---|---|---|---|
| Liberal Democrats | Sandra Jane Holliday* | 880 | 62.5 | +14.5 | |
| Conservative | Joseph Charles Grout | 304 | 21.6 | -8.8 | |
| Labour | Julie Frances Farmer | 223 | 15.8 | +5.9 | |
| Majority | 576 | 40.9 | |||
| Turnout | 1,407 | 29.5 | -2.5 | ||
| Liberal Democrats hold | Swing | ||||
St Paul's
| Party | Candidate | Votes | % | ±% | |
|---|---|---|---|---|---|
| Green | Tabi Joy | 586 | 50.4 | +27.5 | |
| Liberal Democrats | Jayjay Potter-Peachey | 437 | 37.6 | +4.1 | |
| Conservative | Susan Mary Godwin | 139 | 12.0 | -5.7 | |
| Majority | 149 | ||||
| Turnout | 1,162 | 26.6 | -2.4 | ||
| Green gain from Liberal Democrats | Swing | ||||
St Peter's
| Party | Candidate | Votes | % | ±% | |
|---|---|---|---|---|---|
| Liberal Democrats | Victoria Mae Atherstone* | 1,118 | 66.9 | +14.4 | |
| Conservative | Rosemary Jaquine Baillie | 365 | 21.9 | -5.3 | |
| Labour | Clive Robert Harriss | 187 | 11.2 | +2.8 | |
| Majority | 753 | 45.0 | |||
| Turnout | 1,670 | 30.1 | -2.9 | ||
| Liberal Democrats hold | Swing | ||||
Swindon Village
| Party | Candidate | Votes | % | ±% | |
|---|---|---|---|---|---|
| Liberal Democrats | Flo Clucas* | 841 | 64.6 | +16.3 | |
| Conservative | Edward Wadih Hazzan | 319 | 24.5 | -5.0 | |
| Green | Thomas Edward William Boden | 142 | 10.9 | -2.9 | |
| Majority | 522 | 40.1 | |||
| Turnout | 1,302 | 29.9 | -5.1 | ||
| Liberal Democrats hold | Swing | ||||
Up Hatherley
| Party | Candidate | Votes | % | ±% | |
|---|---|---|---|---|---|
| Liberal Democrats | Adrian Stephen Bamford | 1,197 | 63.1 | +15.8 | |
| Conservative | Roger Graham Fox | 533 | 28.1 | -11.1 | |
| Green | Samantha Diane Hodges | 167 | 8.8 | -0.8 | |
| Majority | 664 | 35.0 | |||
| Turnout | 1,897 | 45.7 | -4.3 | ||
| Liberal Democrats hold | Swing | ||||
Warden Hill
| Party | Candidate | Votes | % | ±% | |
|---|---|---|---|---|---|
| Liberal Democrats | Graham Anthony Beale | 1,088 | 57.1 | +9.9 | |
| Conservative | Carl Leigh Jones | 606 | 31.8 | -9.6 | |
| Green | Tim Bonsor | 149 | 7.8 | ±0.0 | |
| Labour | Ian Hugh White | 61 | 3.2 | -0.4 | |
| Majority | 482 | 25.3 | |||
| Turnout | 1,904 | 43.7 | -4.3 | ||
| Liberal Democrats hold | Swing | ||||
By-elections
Battledown
| Party | Candidate | Votes | % | ±% | |
|---|---|---|---|---|---|
| Liberal Democrats | Ed Chidley | 877 | 52.0 | +11.2 | |
| Conservative | Marcia Jacko | 609 | 36.1 | -10.3 | |
| Green | Ian Cameron | 156 | 9.3 | -3.5 | |
| Labour | Caroline Gavin | 43 | 2.6 | N/A | |
| Majority | 268 | 15.9 | N/A | ||
| Turnout | 1,685 | 35.4 | -4.6 | ||
| Liberal Democrats gain from Conservative | Swing | ||||
Prestbury
| Party | Candidate | Votes | % | ±% | |
|---|---|---|---|---|---|
| PAB | Stan Smith | 644 | 37.2 | -8.5 | |
| Green | Jan Foster | 484 | 27.9 | +9.6 | |
| Liberal Democrats | Ben Ingram | 346 | 20.0 | +5.4 | |
| Conservative | Laura Kennedy | 258 | 14.9 | -6.5 | |
| Majority | 160 | 9.3 | -15.0 | ||
| Turnout | 1,732 | 36.7 | -7.9 | ||
| PAB hold | Swing | ||||
References
- ↑ "Elections on 5 May 2022". democracy.cheltenham.gov.uk. 12 April 2022.
- ↑ "Statement of persons nominated". democracy.cheltenham.gov.uk. 12 April 2022.
- ↑ "Election results for All Saints, 5 May 2022". democracy.cheltenham.gov.uk. 5 May 2022.
- ↑ "Election results for Battledown, 5 May 2022". democracy.cheltenham.gov.uk. 5 May 2022.
- ↑ "Election results for Benhall & The Reddings, 5 May 2022". democracy.cheltenham.gov.uk. 5 May 2022.
- ↑ "Election results for Charlton Kings, 5 May 2022". democracy.cheltenham.gov.uk. 5 May 2022.
- ↑ "Election results for Charlton Park, 5 May 2022". democracy.cheltenham.gov.uk. 5 May 2022.
- ↑ "Election results for Hesters Way, 5 May 2022". democracy.cheltenham.gov.uk. 5 May 2022.
- ↑ "Election results for Lansdown, 5 May 2022". democracy.cheltenham.gov.uk. 5 May 2022.
- ↑ "Election results for Leckhampton, 5 May 2022". democracy.cheltenham.gov.uk. 5 May 2022.
- ↑ "Election results for Oakley, 5 May 2022". democracy.cheltenham.gov.uk. 5 May 2022.
- ↑ "Election results for Park, 5 May 2022". democracy.cheltenham.gov.uk. 5 May 2022.
- ↑ "Election results for Pittville, 5 May 2022". democracy.cheltenham.gov.uk. 5 May 2022.
- ↑ "Election results for Prestbury, 5 May 2022". democracy.cheltenham.gov.uk. 5 May 2022.
- ↑ "Election results for Springbank, 5 May 2022". democracy.cheltenham.gov.uk. 5 May 2022.
- ↑ "Election results for St Mark's, 5 May 2022". democracy.cheltenham.gov.uk. 5 May 2022.
- ↑ "Election results for St Paul's, 5 May 2022". democracy.cheltenham.gov.uk. 5 May 2022.
- ↑ "Election results for St Peter's, 5 May 2022". democracy.cheltenham.gov.uk. 5 May 2022.
- ↑ "Election results for Swindon Village, 5 May 2022". democracy.cheltenham.gov.uk. 5 May 2022.
- ↑ "Election results for Up Hatherley, 5 May 2022". democracy.cheltenham.gov.uk. 5 May 2022.
- ↑ "Election results for Warden Hill, 5 May 2022". democracy.cheltenham.gov.uk. 5 May 2022.
| Gloucestershire County Council | |
|---|---|
| Cheltenham Borough Council | |
| Cotswold District Council | |
| Forest of Dean District Council | |
| Gloucester City Council | |
| South Gloucestershire Council | |
| Stroud District Council | |
| Tewkesbury Borough Council | |
| Avon County Council |
|
| Kingswood Borough Council |
|
| Northavon District Council |
|
| West of England Mayor | |
| |
This article is issued from Wikipedia. The text is licensed under Creative Commons - Attribution - Sharealike. Additional terms may apply for the media files.