| |||||||||||||||||||||||||||||||||||||||||||||||||||||||||||
13 out of 36 seats to Worcester City Council 19 seats needed for a majority | |||||||||||||||||||||||||||||||||||||||||||||||||||||||||||
|---|---|---|---|---|---|---|---|---|---|---|---|---|---|---|---|---|---|---|---|---|---|---|---|---|---|---|---|---|---|---|---|---|---|---|---|---|---|---|---|---|---|---|---|---|---|---|---|---|---|---|---|---|---|---|---|---|---|---|---|
| |||||||||||||||||||||||||||||||||||||||||||||||||||||||||||
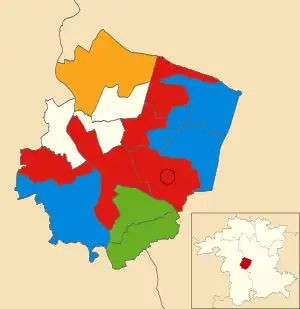 Winner of each seat at the 2022 Worcester City Council election | |||||||||||||||||||||||||||||||||||||||||||||||||||||||||||
| |||||||||||||||||||||||||||||||||||||||||||||||||||||||||||
The 2022 Worcester City Council election took place on 5 May 2022 to elect councillors to Worcester City Council in England.
Results summary
| 2022 Worcester City Council election[1] | ||||||||||
|---|---|---|---|---|---|---|---|---|---|---|
| Party | This election | Full council | This election | |||||||
| Seats | Net | Seats % | Other | Total | Total % | Votes | Votes % | +/− | ||
| Conservative | 4 | 30.8 | 11 | 15 | 42.9 | 7,668 | 31.5 | -7.7 | ||
| Labour | 6 | 46.2 | 6 | 12 | 34.3 | 7,854 | 32.2 | +4.4 | ||
| Green | 2 | 15.4 | 4 | 6 | 17.1 | 4,349 | 17.8 | +2.8 | ||
| Liberal Democrats | 1 | 7.7 | 1 | 2 | 8.6 | 3,596 | 14.8 | +5.7 | ||
| Independent | 0 | 0.0 | 0 | 0 | 0.0 | 746 | 3.1 | N/A | ||
| TUSC | 0 | 0.0 | 0 | 0 | 0.0 | 93 | 0.4 | +0.2 | ||
| Reform UK | 0 | 0.0 | 0 | 0 | 0.0 | 59 | 0.2 | -0.4 | ||
Ward results
Battenhall
| Party | Candidate | Votes | % | ±% | |
|---|---|---|---|---|---|
| Green | Tom Piotrowski | 1,346 | 68.4 | +7.9 | |
| Conservative | Peter Rodford | 398 | 20.2 | -10.5 | |
| Labour | Graham Taylor | 189 | 9.6 | +2.8 | |
| Liberal Democrats | Pyers Symon | 36 | 1.8 | -0.2 | |
| Majority | 948 | 48.2 | |||
| Turnout | 1,975 | 48.1 | |||
| Green hold | Swing | ||||
Bedwardine
| Party | Candidate | Votes | % | ±% | |
|---|---|---|---|---|---|
| Conservative | Shafaz Ditta | 841 | 31.8 | -22.7 | |
| Labour | Sue Smith | 818 | 30.9 | +5.0 | |
| Independent | Joe Amos | 575 | 21.7 | N/A | |
| Green | Katie Collier | 213 | 8.0 | -1.0 | |
| Liberal Democrats | John ONdreasz | 155 | 5.9 | -1.6 | |
| Reform UK | Max Windsor-Peplow | 30 | 1.1 | N/A | |
| TUSC | Eloise Davies | 16 | 0.6 | N/A | |
| Majority | 23 | 0.9 | |||
| Turnout | 2,655 | 39.1 | |||
| Conservative hold | Swing | ||||
Cathedral
| Party | Candidate | Votes | % | ±% | |
|---|---|---|---|---|---|
| Labour | Jabba Riaz | 1,513 | 51.6 | +11.3 | |
| Conservative | Raffi Ali | 843 | 28.7 | -10.3 | |
| Green | Jon Bodenham | 320 | 10.9 | -1.2 | |
| Liberal Democrats | Jessie Venegas | 211 | 7.2 | +3.0 | |
| TUSC | Archie Harrison | 48 | 1.6 | +0.5 | |
| Majority | 670 | 22.9 | |||
| Turnout | 2,963 | 34.9 | |||
| Labour hold | Swing | ||||
Claines
| Party | Candidate | Votes | % | ±% | |
|---|---|---|---|---|---|
| Liberal Democrats | Mel Allcot | 1,933 | 70.2 | +28.4 | |
| Conservative | Louie Lynch | 534 | 19.4 | -20.1 | |
| Labour | Tom Henri | 153 | 5.6 | -3.5 | |
| Green | Steve Dent | 134 | 4.9 | -3.2 | |
| Majority | 1,399 | 50.8 | |||
| Turnout | 2,758 | 42.8 | |||
| Liberal Democrats gain from Conservative | Swing | ||||
Gorse Hill
| Party | Candidate | Votes | % | ±% | |
|---|---|---|---|---|---|
| Conservative | Mohammed Altaf | 535 | 46.0 | -5.5 | |
| Labour | Edward Kimberley | 364 | 31.3 | -6.2 | |
| Green | Heather McNeillis | 239 | 20.6 | +13.3 | |
| Liberal Democrats | Alison Morgan | 25 | 2.1 | -1.6 | |
| Majority | 171 | 14.7 | |||
| Turnout | 1,173 | 30.6 | |||
| Conservative hold | Swing | ||||
Nunnery
| Party | Candidate | Votes | % | ±% | |
|---|---|---|---|---|---|
| Labour | Pat Agar | 1,156 | 50.8 | +14.7 | |
| Labour | Basharat Ali | 959 | 42.1 | +6.0 | |
| Conservative | Adele Rimell | 728 | 32.0 | -18.5 | |
| Conservative | Tomasz Wisniewski | 661 | 29.0 | -21.5 | |
| Green | Barbara Mitra | 302 | 13.3 | +3.7 | |
| Green | Nicola Silvester | 186 | 8.2 | -1.4 | |
| Independent | David Carney | 171 | 7.5 | N/A | |
| Liberal Democrats | Mark Fenton | 127 | 5.6 | +3.1 | |
| Turnout | 2,277 | 35.2 | |||
| Labour hold | Swing | ||||
| Labour gain from Conservative | Swing | ||||
Rainbow Hill
| Party | Candidate | Votes | % | ±% | |
|---|---|---|---|---|---|
| Labour | Zoe Cookson | 535 | 52.1 | +3.3 | |
| Conservative | Parveen Akhtar | 300 | 29.2 | -1.0 | |
| Green | Nick Weeks | 135 | 13.1 | -0.6 | |
| Liberal Democrats | Simon Cottingham | 57 | 5.6 | +0.6 | |
| Majority | 235 | 22.9 | |||
| Turnout | 1,034 | 25.3 | |||
| Labour hold | Swing | ||||
St. John
| Party | Candidate | Votes | % | ±% | |
|---|---|---|---|---|---|
| Labour | Matt Lamb | 990 | 59.3 | +14.5 | |
| Conservative | Laszlo Meszaros | 444 | 26.6 | -8.3 | |
| Green | Tor Pingree | 116 | 6.9 | -4.4 | |
| Liberal Democrats | Peter Jackson | 91 | 5.4 | -1.0 | |
| TUSC | Mark Davies | 29 | 1.7 | -0.9 | |
| Majority | 546 | 32.7 | |||
| Turnout | 1,675 | 26.7 | |||
| Labour hold | Swing | ||||
St. Peter's Parish
| Party | Candidate | Votes | % | ±% | |
|---|---|---|---|---|---|
| Green | Steve Cockeram | 896 | 44.7 | +27.7 | |
| Conservative | Anja Potze | 643 | 32.1 | -22.6 | |
| Liberal Democrats | Robert Renshaw | 312 | 15.6 | N/A | |
| Labour | Chris Giles | 125 | 6.2 | -11.9 | |
| Reform UK | Paul Hickling | 29 | 1.4 | N/A | |
| Majority | 253 | 12.6 | |||
| Turnout | 2,006 | 44.8 | |||
| Green gain from Conservative | Swing | ||||
Warndon Parish North
| Party | Candidate | Votes | % | ±% | |
|---|---|---|---|---|---|
| Conservative | Stephen Hodgson | 571 | 40.6 | -3.7 | |
| Liberal Democrats | Sarah Murray | 516 | 36.7 | +29.1 | |
| Labour | Ian Craigan | 224 | 15.9 | -15.0 | |
| Green | Emily Bond | 94 | 6.7 | -3.0 | |
| Majority | 55 | 3.9 | |||
| Turnout | 1,412 | 35.0 | |||
| Conservative hold | Swing | ||||
Warndon Parish South
| Party | Candidate | Votes | % | ±% | |
|---|---|---|---|---|---|
| Conservative | Andy Roberts | 863 | 53.3 | +16.5 | |
| Labour | Ruth Coates | 382 | 23.6 | +7.6 | |
| Green | Andrew Cross | 284 | 17.5 | -17.1 | |
| Liberal Democrats | John Rudge | 90 | 5.6 | +0.4 | |
| Majority | 481 | 29.7 | |||
| Turnout | 1,622 | 35.4 | |||
| Conservative hold | Swing | ||||
Warndon
| Party | Candidate | Votes | % | ±% | |
|---|---|---|---|---|---|
| Labour | Jill Desayrah | 446 | 50.7 | +8.8 | |
| Conservative | Chris Rimell | 307 | 34.9 | -8.4 | |
| Green | Sue Avery | 84 | 9.5 | +0.6 | |
| Liberal Democrats | Susan Carpenter | 43 | 4.9 | -1.0 | |
| Majority | 139 | 15.8 | |||
| Turnout | 881 | 22.6 | |||
| Labour hold | Swing | ||||
References
- ↑ "2022 Elections". Worcester City Council. Retrieved 11 May 2022.
| Worcestershire CC | |
|---|---|
| Bromsgrove | |
| Malvern Hills | |
| Redditch | |
| Worcester | |
| Wychavon | |
| Wyre Forest | |
| Hereford & Worcester CC |
|
| |
This article is issued from Wikipedia. The text is licensed under Creative Commons - Attribution - Sharealike. Additional terms may apply for the media files.