Le Tampon | |
|---|---|
 The church of Le Tampon | |
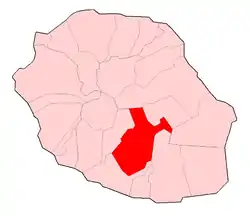 | |
Location of Le Tampon | |
| Coordinates: 21°16′41″S 55°30′55″E / 21.2781°S 55.5153°E | |
| Country | France |
| Overseas region and department | Réunion |
| Arrondissement | Saint Pierre |
| Canton | 2 cantons |
| Intercommunality | CA du Sud |
| Government | |
| • Mayor (2020–2026) | André Thien Ah Koon[1] |
| Area 1 | 165.43 km2 (63.87 sq mi) |
| Population | 81,943 |
| • Density | 500/km2 (1,300/sq mi) |
| Time zone | UTC+04:00 |
| INSEE/Postal code | 97422 /97430 |
| Elevation | 287–2,418 m (942–7,933 ft) (avg. 546 m or 1,791 ft) |
| 1 French Land Register data, which excludes lakes, ponds, glaciers > 1 km2 (0.386 sq mi or 247 acres) and river estuaries. | |
Le Tampon (French pronunciation: [lə tɑ̃pɔ̃]) is the fourth-largest commune in the French overseas department and region of Réunion. It is located on the south-central part of the island of Réunion, adjacent to Saint Pierre.
In the early twentieth century, the town was the base for the murderer and sorcerer Sitarane.[3]
Geography
Climate
Le Tampon has an oceanic climate (Köppen climate classification Cfb). The average annual temperature in Le Tampon is 13.8 °C (56.8 °F). The average annual rainfall is 2,020.2 mm (79.54 in) with February as the wettest month. The temperatures are highest on average in February, at around 17.3 °C (63.1 °F), and lowest in July, at around 10.3 °C (50.5 °F). The highest temperature ever recorded in Le Tampon was 29.6 °C (85.3 °F) on 26 October 2011; the coldest temperature ever recorded was −1.7 °C (28.9 °F) on 18 August 1988.
| Climate data for Le Tampon (altitude 860m, 1991–2020 normals, extremes 1969–present) | |||||||||||||
|---|---|---|---|---|---|---|---|---|---|---|---|---|---|
| Month | Jan | Feb | Mar | Apr | May | Jun | Jul | Aug | Sep | Oct | Nov | Dec | Year |
| Record high °C (°F) | 31.2 (88.2) |
31.0 (87.8) |
31.2 (88.2) |
30.4 (86.7) |
28.1 (82.6) |
26.5 (79.7) |
26.9 (80.4) |
26.1 (79.0) |
26.9 (80.4) |
28.3 (82.9) |
30.1 (86.2) |
31.5 (88.7) |
31.5 (88.7) |
| Mean daily maximum °C (°F) | 26.7 (80.1) |
26.8 (80.2) |
26.4 (79.5) |
25.4 (77.7) |
23.7 (74.7) |
21.8 (71.2) |
21.0 (69.8) |
21.2 (70.2) |
21.9 (71.4) |
23.1 (73.6) |
24.4 (75.9) |
26.0 (78.8) |
24.0 (75.2) |
| Daily mean °C (°F) | 22.1 (71.8) |
22.3 (72.1) |
21.8 (71.2) |
20.6 (69.1) |
18.8 (65.8) |
16.9 (62.4) |
16.0 (60.8) |
16.1 (61.0) |
16.7 (62.1) |
17.8 (64.0) |
19.2 (66.6) |
20.9 (69.6) |
19.1 (66.4) |
| Mean daily minimum °C (°F) | 17.6 (63.7) |
17.8 (64.0) |
17.2 (63.0) |
15.9 (60.6) |
13.9 (57.0) |
12.0 (53.6) |
11.1 (52.0) |
11.0 (51.8) |
11.4 (52.5) |
12.5 (54.5) |
14.0 (57.2) |
15.9 (60.6) |
14.2 (57.6) |
| Record low °C (°F) | 11.7 (53.1) |
12.5 (54.5) |
11.0 (51.8) |
9.1 (48.4) |
7.9 (46.2) |
6.3 (43.3) |
5.0 (41.0) |
5.6 (42.1) |
5.2 (41.4) |
5.9 (42.6) |
6.1 (43.0) |
10.5 (50.9) |
5.0 (41.0) |
| Average precipitation mm (inches) | 313.3 (12.33) |
321.8 (12.67) |
195.8 (7.71) |
111.9 (4.41) |
72.0 (2.83) |
61.3 (2.41) |
55.4 (2.18) |
31.1 (1.22) |
35.0 (1.38) |
34.0 (1.34) |
49.8 (1.96) |
143.0 (5.63) |
1,424.4 (56.08) |
| Average precipitation days (≥ 1.0 mm) | 13.3 | 13.9 | 11.9 | 8.5 | 7.1 | 6.2 | 5.5 | 4.3 | 4.3 | 4.9 | 6.6 | 9.7 | 96.2 |
| Source: Météo-France[4] | |||||||||||||
| Climate data for Le Tampon (Plaine des Cafres, altitude 1560m, 1991–2020 normals, extremes 1965–present) | |||||||||||||
|---|---|---|---|---|---|---|---|---|---|---|---|---|---|
| Month | Jan | Feb | Mar | Apr | May | Jun | Jul | Aug | Sep | Oct | Nov | Dec | Year |
| Record high °C (°F) | 26.6 (79.9) |
26.7 (80.1) |
26.2 (79.2) |
25.8 (78.4) |
24.3 (75.7) |
22.5 (72.5) |
21.9 (71.4) |
23.5 (74.3) |
24.8 (76.6) |
29.6 (85.3) |
28.2 (82.8) |
26.7 (80.1) |
29.6 (85.3) |
| Mean daily maximum °C (°F) | 21.9 (71.4) |
22.0 (71.6) |
21.6 (70.9) |
20.7 (69.3) |
18.7 (65.7) |
16.6 (61.9) |
15.7 (60.3) |
16.1 (61.0) |
17.1 (62.8) |
18.8 (65.8) |
20.3 (68.5) |
21.4 (70.5) |
19.2 (66.6) |
| Daily mean °C (°F) | 17.5 (63.5) |
17.6 (63.7) |
17.1 (62.8) |
15.9 (60.6) |
13.7 (56.7) |
11.5 (52.7) |
10.7 (51.3) |
10.8 (51.4) |
11.6 (52.9) |
13.1 (55.6) |
14.6 (58.3) |
16.3 (61.3) |
14.2 (57.6) |
| Mean daily minimum °C (°F) | 13.0 (55.4) |
13.3 (55.9) |
12.5 (54.5) |
11.1 (52.0) |
8.7 (47.7) |
6.5 (43.7) |
5.7 (42.3) |
5.5 (41.9) |
6.1 (43.0) |
7.5 (45.5) |
8.8 (47.8) |
11.2 (52.2) |
9.2 (48.6) |
| Record low °C (°F) | 5.1 (41.2) |
5.0 (41.0) |
4.2 (39.6) |
2.2 (36.0) |
0.8 (33.4) |
−0.9 (30.4) |
−1.4 (29.5) |
−1.7 (28.9) |
−1.6 (29.1) |
−0.3 (31.5) |
−0.4 (31.3) |
2.0 (35.6) |
−1.7 (28.9) |
| Average precipitation mm (inches) | 426.1 (16.78) |
427.8 (16.84) |
303.0 (11.93) |
124.0 (4.88) |
80.6 (3.17) |
62.1 (2.44) |
62.4 (2.46) |
50.1 (1.97) |
43.2 (1.70) |
42.5 (1.67) |
62.9 (2.48) |
162.7 (6.41) |
1,847.4 (72.73) |
| Average precipitation days (≥ 1.0 mm) | 15.1 | 15.2 | 13.8 | 11.5 | 10.0 | 9.5 | 10.3 | 8.8 | 7.7 | 6.3 | 6.8 | 10.8 | 125.9 |
| Mean monthly sunshine hours | 166.4 | 138.6 | 165.1 | 165.2 | 182.4 | 176.9 | 182.2 | 193.5 | 188.4 | 184.0 | 182.4 | 164.6 | 2,089.7 |
| Source 1: Météo France[5] | |||||||||||||
| Source 2: Meteociel.fr (sunshine 1981-2010)[6] | |||||||||||||
Population
| Year | Pop. | ±% p.a. |
|---|---|---|
| 1961 | 24,335 | — |
| 1967 | 31,378 | +4.33% |
| 1974 | 36,107 | +2.03% |
| 1982 | 40,545 | +1.46% |
| 1990 | 47,593 | +2.02% |
| 1999 | 60,323 | +2.67% |
| 2007 | 70,539 | +1.97% |
| 2012 | 75,631 | +1.40% |
| 2017 | 78,629 | +0.78% |
| Source: SPLAF[7] and INSEE (1967-2017)[8] | ||
Cantons
The commune of Le Tampon has been divided into two cantons since the canton reorganisation of March 2015. Their seat is in Le Tampon.[9]
| Name | Population (2019)[10] | Cantonal Code |
|---|---|---|
| Canton of Le Tampon-1 | 40,342 | 97424 |
| Canton of Le Tampon-2 | 39,482 | 97425 |
See also
References
- ↑ "Répertoire national des élus: les maires". data.gouv.fr, Plateforme ouverte des données publiques françaises (in French). 2 December 2020.
- ↑ "Populations légales 2021". The National Institute of Statistics and Economic Studies. 28 December 2023.
- ↑ Iledelareunion.net: Sitarane (in French)
- ↑ "Fiche Climatologique Statistiques 1991-2020 et records" (PDF) (in French). Météo-France. Retrieved August 30, 2022.
- ↑ "Climate of Plaine des Cafres 1991-2020" (PDF) (in French). Météo-France. Retrieved September 1, 2022.
- ↑ "Normales / Moyennes 1981-2010 / Plaine des Cafres (974)" (in French). Météo-France. Retrieved September 1, 2022.
- ↑ SPLAF (la Population et les Limites Administratives de la France). "Agglomérations et villes de la Réunion" [Towns and cities of Reunion Island]. Retrieved 23 February 2021.
- ↑ Population en historique depuis 1968, INSEE
- ↑ "Décret n° 2014-236 du 24 février 2014 portant délimitation des cantons dans le département de La Réunion | Legifrance". Retrieved 2017-07-19.
- ↑ Populations légales 2019: 974 Département de la Réunion, INSEE
External links
- Official website (in French)