Liubei
柳北区 · Liujbwj Gih | |
|---|---|
.jpg.webp) Skyline of Liubei District in April 2019 | |
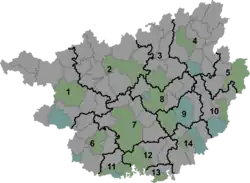 Liubei Location in Guangxi | |
| Coordinates: 24°22′09″N 109°23′55″E / 24.3693°N 109.3985°E[1] | |
| Country | People's Republic of China |
| Autonomous region | Guangxi |
| Prefecture-level city | Liuzhou |
| Area | |
| • Total | 301.27 km2 (116.32 sq mi) |
| Population (2010)[3] | |
| • Total | 428,043 |
| • Density | 1,400/km2 (3,700/sq mi) |
| Time zone | UTC+8 (China Standard) |
Liubei District (simplified Chinese: 柳北区; traditional Chinese: 柳北區; pinyin: Liǔběi Qū; Standard Zhuang: Liujbwj Gih) is the county seat and one of four districts of Liuzhou, Guangxi Zhuang Autonomous Region, China.
Climate
| Climate data for Shatangzhen, Liubei District (1991–2020 normals) | |||||||||||||
|---|---|---|---|---|---|---|---|---|---|---|---|---|---|
| Month | Jan | Feb | Mar | Apr | May | Jun | Jul | Aug | Sep | Oct | Nov | Dec | Year |
| Mean daily maximum °C (°F) | 14.0 (57.2) |
16.4 (61.5) |
19.4 (66.9) |
25.2 (77.4) |
29.4 (84.9) |
31.4 (88.5) |
33.1 (91.6) |
33.4 (92.1) |
31.8 (89.2) |
27.8 (82.0) |
22.8 (73.0) |
17.2 (63.0) |
25.2 (77.3) |
| Daily mean °C (°F) | 9.9 (49.8) |
12.3 (54.1) |
15.5 (59.9) |
20.9 (69.6) |
24.8 (76.6) |
27.1 (80.8) |
28.4 (83.1) |
28.2 (82.8) |
26.2 (79.2) |
22.0 (71.6) |
16.9 (62.4) |
11.6 (52.9) |
20.3 (68.6) |
| Mean daily minimum °C (°F) | 7.1 (44.8) |
9.4 (48.9) |
12.8 (55.0) |
17.7 (63.9) |
21.4 (70.5) |
24.1 (75.4) |
25.0 (77.0) |
24.7 (76.5) |
22.4 (72.3) |
18.0 (64.4) |
12.9 (55.2) |
8.0 (46.4) |
17.0 (62.5) |
| Average precipitation mm (inches) | 61.7 (2.43) |
47.0 (1.85) |
106.1 (4.18) |
133.6 (5.26) |
230.6 (9.08) |
318.3 (12.53) |
207.8 (8.18) |
159.4 (6.28) |
76.5 (3.01) |
51.0 (2.01) |
52.4 (2.06) |
46.5 (1.83) |
1,490.9 (58.7) |
| Average precipitation days | 12.3 | 12.2 | 17.6 | 16.0 | 15.6 | 17.8 | 15.7 | 13.4 | 8.4 | 6.9 | 8.0 | 8.9 | 152.8 |
| Average snowy days | 0.4 | 0.1 | 0 | 0 | 0 | 0 | 0 | 0 | 0 | 0 | 0 | 0.2 | 0.7 |
| Average relative humidity (%) | 78 | 78 | 82 | 81 | 81 | 83 | 80 | 80 | 78 | 76 | 77 | 75 | 79 |
| Mean monthly sunshine hours | 59.8 | 52.5 | 50.5 | 80.1 | 122.6 | 119.4 | 178.0 | 188.4 | 177.7 | 164.8 | 129.7 | 109.8 | 1,433.3 |
| Percent possible sunshine | 18 | 16 | 14 | 21 | 30 | 29 | 43 | 47 | 49 | 46 | 40 | 33 | 32 |
| Source: China Meteorological Administration[4][5] | |||||||||||||
References
- ↑ Google (2014-07-02). "Que'er Mountain Subdistrict Office" (Map). Google Maps. Google. Retrieved 2014-07-02.
- ↑ Liuzhou City Land Use Plan (2006–20)/《柳州市土地利用总体规划(2006-2020年)》.(in Chinese) Accessed 8 July 2014.
- ↑ 《中国2010年人口普查分县资料》 (in Chinese). 中国统计出版社. December 2012. ISBN 978-7-5037-6659-6.
- ↑ 中国气象数据网 – WeatherBk Data (in Simplified Chinese). China Meteorological Administration. Retrieved 14 April 2023.
- ↑ 中国气象数据网 (in Simplified Chinese). China Meteorological Administration. Retrieved 14 April 2023.
External links
This article is issued from Wikipedia. The text is licensed under Creative Commons - Attribution - Sharealike. Additional terms may apply for the media files.