| Sanderstead | |
|---|---|
| ward for Croydon Council | |
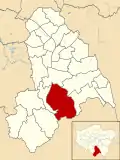 Boundary of Sanderstead in Croydon from 2002. | |
| County | Greater London |
| Current ward | |
| Created | 1978 |
| Councillor | Lynne Hale (Conservative) |
| Councillor | Yvette Hopley (Conservative) |
| Councillor | Helen Redfern (Conservative) |
| Number of councillors | Three (2002-Present), Two (1978-2002) |
| Created from | Sanderstead and Selsdon |
| UK Parliament constituency | Croydon South |
Sanderstead is a ward in the London Borough of Croydon.[1][2] The ward received boundary changes in 2018, gaining territory from Croham ward, but losing Riddlesdown to Purley Oaks and Riddlesdown ward. The first election with new boundaries was 3 May 2018.
List of Councillors
| Election | Councillor | Party | Councillor | Party | Councillor | Party | ||||||
|---|---|---|---|---|---|---|---|---|---|---|---|---|
| 1978 | Ward created | |||||||||||
| David N. Bowen | Conservative | Ronald W. Haskins | Conservative | 2 Councillors 1978-2002 | ||||||||
| 1986 | Colin J. Hood | Conservative | Bruce T. H. Marshall | Conservative | ||||||||
| 1990 | Graham T. W. Speed | Conservative | ||||||||||
| 1995 | Eric Shaw | Conservative | ||||||||||
| 1998 | Lynne Hale | Conservative | ||||||||||
| 2002 | Timothy S. Pollard | Conservative | ||||||||||
| 2006 | Yvette Hopley | Conservative | ||||||||||
| 2022 | Helen Redfern | Conservative | ||||||||||
Mayoral election results
Below are the results for the candidate which received the highest share of the popular vote in the ward at each mayoral election.
| Year | Mayoral candidate | Party | Winner? | |
|---|---|---|---|---|
| 2022 | Jason Perry | Conservative | ||
Ward Results
| Party | Candidate | Votes | % | ±% | |
|---|---|---|---|---|---|
| Conservative | Yvette Hopley* | 3,826 | |||
| Conservative | Lynne Hale* | 3,806 | |||
| Conservative | Helen Redfern† | 3,596 | |||
| Liberal Democrats | James Clark | 718 | |||
| Liberal Democrats | Annie Jordan | 705 | |||
| Labour | Laura Doughty | 658 | |||
| Green | Helen Buckland | 591 | |||
| Labour | Alan Malarkey | 572 | |||
| Labour | Tim Rodgers | 549 | |||
| Liberal Democrats | Edward Wells | 510 | |||
| Green | Connie Muir | 465 | |||
| Green | Oliver Duxbury | 407 | |||
| Turnout | 48.36 | ||||
| Conservative hold | Swing | ||||
| Conservative hold | Swing | ||||
| Conservative hold | Swing | ||||
| Party | Candidate | Votes | % | ±% | |
|---|---|---|---|---|---|
| Conservative | Lynne Carol Hale | 3,971 | 24.26 | ||
| Conservative | Yvette Rose Hopley | 3,954 | 24.15 | ||
| Conservative | Timothy Stuart Pollard | 3,844 | 23.48 | ||
| Labour | Paul Wyn Ednyfed Ainscough | 908 | 5.55 | ||
| Labour | Lynda Graham | 904 | 5.52 | ||
| Labour | Joshua Jeremy Jack Andrew | 853 | 5.21 | ||
| Liberal Democrats | John Malcolm Jefkins | 498 | 3.04 | ||
| Liberal Democrats | Annie Samantha Jordan | 462 | 2.82 | ||
| Liberal Democrats | Keith Miller | 357 | 2.18 | ||
| Green | Matt Bullock | 334 | 2.04 | ||
| Green | Hanna Caroline Short | 285 | 1.74 | ||
| Majority | 2,936 | 17.94 | |||
| Turnout | |||||
| Conservative hold | Swing | ||||
| Conservative hold | Swing | ||||
| Conservative hold | Swing | ||||
| Party | Candidate | Votes | % | ±% | |
|---|---|---|---|---|---|
| Conservative | Lynne Hale | 2,691 | |||
| Conservative | Yvette Hopley | 2,545 | |||
| Conservative | Tim Pollard | 2,463 | |||
| UKIP | Claire Smith | 891 | |||
| Labour | Mathew Hill | 570 | |||
| Labour | Thomas Lovesey | 540 | |||
| Labour | Stella Nabukeera | 491 | |||
| Green | Diane Bindman | 422 | |||
| Green | Stephen Harris | 316 | |||
| Green | Marc Richards | 295 | |||
| Liberal Democrats | Thomas Hesmondhalgh | 266 | |||
| Liberal Democrats | Elizabeth Moran | 242 | |||
| Liberal Democrats | Toby Keynes | 208 | |||
| Majority | |||||
| Turnout | |||||
| Conservative hold | Swing | ||||
| Conservative hold | Swing | ||||
| Conservative hold | Swing | ||||
| Party | Candidate | Votes | % | ±% | |
|---|---|---|---|---|---|
| Conservative | Lynne Hale | 3,567 | |||
| Conservative | Timothy Pollard | 3,470 | |||
| Conservative | Yvette Hopley | 3,447 | |||
| Liberal Democrats | Anne Howard | 570 | |||
| Liberal Democrats | Susan Gauge | 562 | |||
| Labour | Daniel Harvey | 429 | |||
| Labour | Barry Buttigieg | 393 | |||
| Labour | Tejinder Madhar | 369 | |||
| UKIP | Alan Smith | 338 | |||
| Turnout | 4,700 | 48.6% | |||
| Registered electors | 9,663 | ||||
| Conservative hold | Swing | ||||
| Conservative hold | Swing | ||||
| Conservative hold | Swing | ||||
| Party | Candidate | Votes | % | ±% | |
|---|---|---|---|---|---|
| Conservative | Lynne C. Hale | 2,797 | |||
| Conservative | Eric Shaw | 2,740 | |||
| Conservative | Timothy S. Pollard | 2,678 | |||
| Labour | Richard B. Young | 537 | |||
| Liberal Democrats | Michael T.A. Bishopp | 531 | |||
| Labour | Elizabeth M. Wolf | 517 | |||
| Labour | Robert C.E. Brooks | 511 | |||
| Liberal Democrats | Michael K. Frith | 491 | |||
| Liberal Democrats | Geoffrey V. Gauge | 470 | |||
| Majority | |||||
| Turnout | |||||
| Conservative hold | Swing | ||||
| Conservative hold | Swing | ||||
| Conservative hold | Swing | ||||
| Party | Candidate | Votes | % | ±% | |
|---|---|---|---|---|---|
| Conservative | Eric Shaw | 2,183 | |||
| Conservative | Lynne C. Hale | 2,130 | |||
| Labour | Ronald W. Fisher | 628 | |||
| Liberal Democrats | Spencer A. Grady | 470 | |||
| Liberal Democrats | Gavin T. Howard-Jones | 440 | |||
| Labour | Paul J. Smith | 432 | |||
| Independent Resident | Sheila Lee | 41 | |||
| Independent Resident | David Lee | 26 | |||
| Majority | |||||
| Turnout | |||||
| Registered electors | |||||
| Conservative hold | Swing | ||||
| Conservative hold | Swing | ||||
| Party | Candidate | Votes | % | ±% | |
|---|---|---|---|---|---|
| Conservative | Eric Shaw | 1712 | 52.6 | ||
| Liberal Democrats | Gavin T. Howard-Jones | 970 | 29.8 | ||
| Labour | Michael P. J. Phelan | 528 | 16.2 | ||
| Green | Richard J. Hamlyn | 32 | 1.0 | ||
| Ind Green Soc Dem | John S. Cartwright | 15 | 0.5 | ||
| Majority | 742 | 22.8 | |||
| Turnout | 3,257 | ||||
| Conservative hold | Swing | ||||
The by-election was called following the death of Cllr. Bruce T. H. Marshall.
| Party | Candidate | Votes | % | ±% | |
|---|---|---|---|---|---|
| Conservative | Bruce T. H. Marshall | 2,083 | |||
| Conservative | Graham T. W. Speed | 2,024 | |||
| Liberal Democrats | Gavin T. Howard-Jones | 1,104 | |||
| Liberal Democrats | Barry D. Stocker | 909 | |||
| Labour | Roger D. Wicks | 636 | |||
| Labour | Jean-Paul Irtelli | 634 | |||
| The People's Choice | Neville Sprague | 125 | |||
| Majority | 920 | ||||
| Turnout | |||||
| Registered electors | |||||
| Conservative hold | Swing | ||||
| Conservative hold | Swing | ||||
| Party | Candidate | Votes | % | ±% | |
|---|---|---|---|---|---|
| Conservative | Bruce T. H. Marshall | 2,534 | |||
| Conservative | Graham T. W. Speed | 2,331 | |||
| Liberal Democrats | Margaret L. Burnett | 703 | |||
| Liberal Democrats | John Hatherley | 634 | |||
| Labour | Robert J. Irwin | 574 | |||
| Labour | Michael P. J. Phelan | 535 | |||
| Majority | 1,628 | ||||
| Turnout | |||||
| Registered electors | |||||
| Conservative hold | Swing | ||||
| Conservative hold | Swing | ||||
| Party | Candidate | Votes | % | ±% | |
|---|---|---|---|---|---|
| Conservative | Colin J. Hood | 2,178 | |||
| Conservative | Bruce T. H. Marshall | 2,042 | |||
| Alliance | Angela C. Mills | 896 | |||
| Alliance | Raymond W. Bustin | 883 | |||
| Labour | Anthony J. Lear | 352 | |||
| Labour | Rose I. White | 294 | |||
| Green | Edmond M. Rosenthal | 149 | |||
| Majority | 1,146 | ||||
| Turnout | |||||
| Registered electors | |||||
| Conservative hold | Swing | ||||
| Conservative hold | Swing | ||||
| Party | Candidate | Votes | % | ±% | |
|---|---|---|---|---|---|
| Conservative | Ronald W. Haskins | 2,649 | |||
| Conservative | David N. Bowen | 2,570 | |||
| Alliance | Raymond W. Bustin | 889 | |||
| Alliance | Eric J. Mann | 853 | |||
| Labour | Keith M. Roberts | 163 | |||
| Labour | Lillian L. Scott | 158 | |||
| Turnout | |||||
| Conservative hold | Swing | ||||
| Conservative hold | Swing | ||||
| Party | Candidate | Votes | % | ±% | |
|---|---|---|---|---|---|
| Conservative | David N. Bowen | 2,823 | |||
| Conservative | Ronald W. Haskins | 2,819 | |||
| Liberal | Trevor J. Barker | 352 | |||
| Liberal | June C. Duffelen | 352 | |||
| Labour | Edward L. Hall | 300 | |||
| Labour | Eileen E. Daisley, J.P. | 298 | |||
| Majority | 2,467 | ||||
| Turnout | |||||
| Registered electors | |||||
| Conservative win (new seat) | |||||
| Conservative win (new seat) | |||||
References
- ↑ "Final recommendations on the new electoral arrangements for Croydon Borough of Croydon" (PDF). Retrieved 10 April 2018.
- ↑ legislation.gov.uk -The London Borough of Croydon (Electoral Changes) Order 2017. Retrieved on 10 April 2018.
- ↑ "London Borough Council Elections 7 May 1998 including the Greater London Authority Referendum results" (PDF). London Datastore. London Research Centre. Retrieved 8 March 2015.
This article is issued from Wikipedia. The text is licensed under Creative Commons - Attribution - Sharealike. Additional terms may apply for the media files.