| |||||||||||||||||||||||||||||||||
13 of the 39 seats to Stevenage Borough Council 20 seats needed for a majority | |||||||||||||||||||||||||||||||||
|---|---|---|---|---|---|---|---|---|---|---|---|---|---|---|---|---|---|---|---|---|---|---|---|---|---|---|---|---|---|---|---|---|---|
| |||||||||||||||||||||||||||||||||
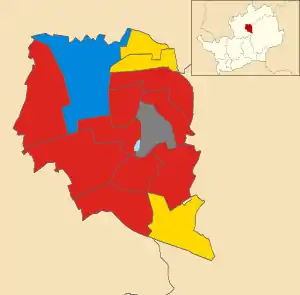 Map showing the results of contested wards in the 1983 Stevenage Borough Council elections. | |||||||||||||||||||||||||||||||||
| |||||||||||||||||||||||||||||||||
The 1983 Stevenage Borough Council election took place on 5 May 1983. This was on the same day as other local elections. One third of the council was up for election and the Labour Party retained control of the council, which it had held continuously since its creation in 1973.
Overall results
| Party | Seats | Gains | Losses | Net gain/loss | Seats % | Votes % | Votes | +/− | ||
|---|---|---|---|---|---|---|---|---|---|---|
| Labour | 9 | 0 | 2 | 69.2 | 41.3 | 10,162 | ||||
| Conservative | 3 | 0 | 0 | 7.7 | 28.4 | 6,987 | ||||
| Alliance | 1 | 2 | 0 | 23.1 | 30.3 | 7,450 | ||||
| Total | 13 | 24,599 | ||||||||
| Labour hold | ||||||||||
Ward results
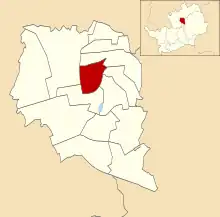
Bandley Hill
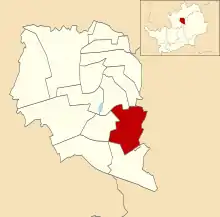
Location of Bandley Hill
| Party | Candidate | Votes | % | |
|---|---|---|---|---|
| Labour | J. Lloyd | 1,040 | 51.4% | |
| Alliance | P. Lucioli | 528 | 26.1% | |
| Conservative | F. Warner | 455 | 22.5% | |
| Turnout | 44.6% | |||
| Labour hold | ||||
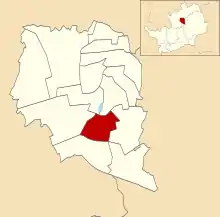
Bedwell Plash
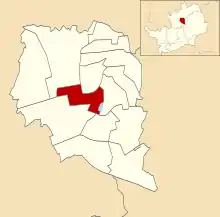
Location of Bedwell Plash ward
| Party | Candidate | Votes | % | |
|---|---|---|---|---|
| Labour | H. Lawrence | 1,109 | 54.8% | |
| Conservative | B. Mann | 507 | 25.0% | |
| Alliance | R. Bull | 409 | 20.2% | |
| Turnout | 49.3% | |||
| Labour hold | ||||
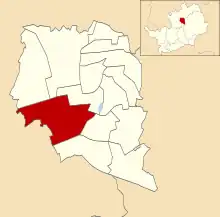
Longmeadow
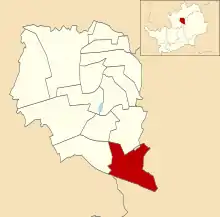
Location of Longmeadow ward
| Party | Candidate | Votes | % | |
|---|---|---|---|---|
| Alliance | D. Peddie | 883 | 37.1% | |
| Conservative | H. Grant | 771 | 32.4% | |
| Labour | J. Tye | 726 | 30.5% | |
| Turnout | 48.3% | |||
| Alliance gain from Labour | ||||
Martins Wood
Location of Martins Wood ward
| Party | Candidate | Votes | % | |
|---|---|---|---|---|
| Labour | B. Clark | 674 | 37.0% | |
| Alliance | P. Amor | 633 | 34.7% | |
| Conservative | T. Hegan | 515 | 28.3% | |
| Turnout | 44.7% | |||
| Labour hold | ||||
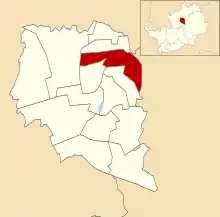
Mobbsbury
Location of Mobbsbury ward
| Party | Candidate | Votes | % | |
|---|---|---|---|---|
| Labour | J. Gotobed | 755 | 41.7% | |
| Conservative | M. Lovett | 566 | 31.3% | |
| Alliance | L. Atkins | 488 | 27.0% | |
| Turnout | 50.1% | |||
| Labour hold | ||||
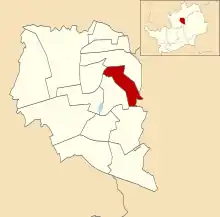
Monkswood
Location of Monkswood ward
| Party | Candidate | Votes | % | |
|---|---|---|---|---|
| Labour | M. Cherney | 698 | 51.0% | |
| Alliance | H. Kearney | 382 | 27.9% | |
| Conservative | W. Travennor | 289 | 21.1% | |
| Turnout | 53.7% | |||
| Labour hold | ||||
Old Stevenage
Location of Old Stevenage ward
| Party | Candidate | Votes | % | |
|---|---|---|---|---|
| Conservative | J. Boyd | 1,120 | 45.4% | |
| Labour | A. Spears | 795 | 32.2% | |
| Alliance | K. Taylor | 554 | 22.4% | |
| Turnout | 49.0% | |||
| Conservative hold | ||||
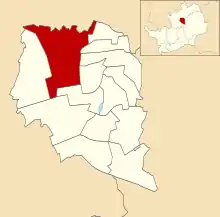
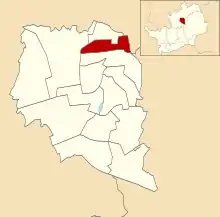
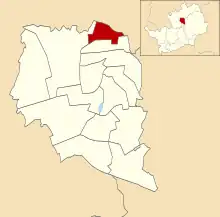
Pin Green
Location of Pin Green ward
| Party | Candidate | Votes | % | |
|---|---|---|---|---|
| Labour | D. Weston | 755 | 40.1% | |
| Alliance | J. Lucioli | 589 | 31.3% | |
| Conservative | M. Mason | 540 | 28.7% | |
| Turnout | 47.8% | |||
| Labour hold | ||||
Roebuck
Location of Roebuck ward
| Party | Candidate | Votes | % | |
|---|---|---|---|---|
| Labour | J. Cockerton | 834 | 40.0% | |
| Alliance | G. Batley | 679 | 32.6% | |
| Conservative | S. McPartland | 570 | 27.4% | |
| Turnout | 48.6% | |||
| Labour hold | ||||
St Nicholas
Location of St Nicholas ward
| Party | Candidate | Votes | % | |
|---|---|---|---|---|
| Alliance | C. Cuthbert | 592 | 41.0% | |
| Labour | M. Downing | 511 | 35.4% | |
| Conservative | T. Woods | 340 | 23.6% | |
| Turnout | 38.8% | |||
| Alliance gain from Labour | ||||
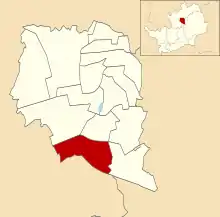
Shephall
Location of Shephall ward
| Party | Candidate | Votes | % | |
|---|---|---|---|---|
| Labour | B. Hall | 866 | 51.9% | |
| Alliance | M. Boutell | 518 | 31.0% | |
| Conservative | E. Kolinski | 285 | 17.1% | |
| Turnout | 46.6% | |||
| Labour hold | ||||
Symonds Green
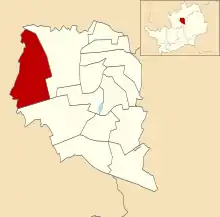
Location of Symonds Green ward
| Party | Candidate | Votes | % | |
|---|---|---|---|---|
| Labour | M. Cotter | 1,115 | 40.5% | |
| Conservative | G. Balderstone | 825 | 30.0% | |
| Alliance | D. Eaton | 811 | 29.5% | |
| Turnout | 51.2% | |||
| Labour hold | ||||
Wellfield
Location of Wellfield ward
| Party | Candidate | Votes | % | |
|---|---|---|---|---|
| Alliance | D. Hills | 370 | 42.4% | |
| Labour | N. Cook | 284 | 32.6% | |
| Conservative | B. Potter | 218 | 25.0 | |
| Turnout | 50.9% | |||
| Labour hold | ||||
References
| Metropolitan boroughs |
|
|---|---|
| District councils (England) |
|
| District councils (Wales) |
|
| |
This article is issued from Wikipedia. The text is licensed under Creative Commons - Attribution - Sharealike. Additional terms may apply for the media files.