| |||||||||||||||||||||||||||||||||
14 of the 39 seats to Stevenage Borough Council 20 seats needed for a majority | |||||||||||||||||||||||||||||||||
|---|---|---|---|---|---|---|---|---|---|---|---|---|---|---|---|---|---|---|---|---|---|---|---|---|---|---|---|---|---|---|---|---|---|
| |||||||||||||||||||||||||||||||||
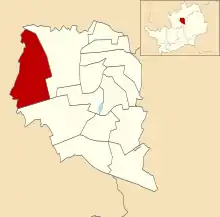
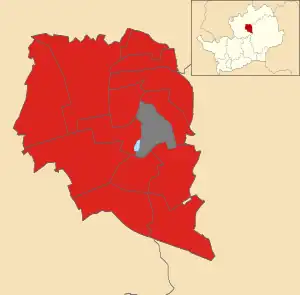 Map showing the results of contested wards in the 1995 Stevenage Borough Council elections. | |||||||||||||||||||||||||||||||||
| |||||||||||||||||||||||||||||||||
The 1995 Stevenage Borough Council election took place on 4 May 1995. This was on the same day as other local elections. One third of the council was up for election; the seats which were last contested in 1991. There was also a second seat up for election in Martins Wood ward. The Labour Party retained control of the council, which it had held continuously since its creation in 1973.
Overall results
| Party | Seats | Gains | Losses | Net gain/loss | Seats % | Votes % | Votes | +/− | ||
|---|---|---|---|---|---|---|---|---|---|---|
| Labour | 14 | 4 | 0 | 100.0 | 67.0 | 13,438 | ||||
| Liberal Democrats | 1 | 0 | 1 | 0.0 | 16.5 | 3,310 | ||||
| Conservative | 0 | 0 | 1 | 15.6 | 3,124 | |||||
| Militant Labour | 0 | 0 | 2 | 0.0 | 0.9 | 189 | ||||
| Total | 13 | 20,061 | ||||||||
| Labour hold | ||||||||||
All comparisons in seats and vote share are to the corresponding 1991 election.
Ward results
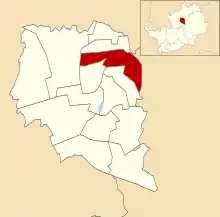
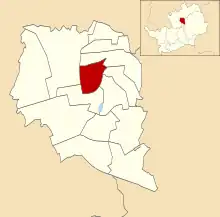
Bandley Hill
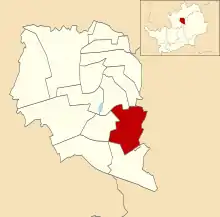
Location of Bandley Hill
| Party | Candidate | Votes | % | |
|---|---|---|---|---|
| Labour | Joan E. Lloyd[4] | 1,327 | 72.2% | |
| Conservative | F. Warner | 196 | 10.7% | |
| Liberal Democrats | A. Segadelli | 184 | 10.0% | |
| Militant Labour | J. Horton | 131 | 7.1% | |
| Turnout | 31.3% | |||
| Labour hold | ||||
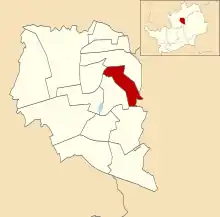
Bedwell Plash
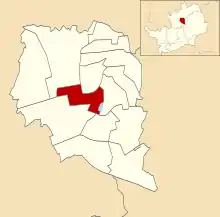
Location of Bedwell Plash ward
| Party | Candidate | Votes | % | |
|---|---|---|---|---|
| Labour | Hilda Lawrence[4] | 1,210 | 81.3% | |
| Conservative | M. Wyatt | 148 | 9.9% | |
| Liberal Democrats | G. Knight | 130 | 8.7% | |
| Turnout | 39.9% | |||
| Labour hold | ||||
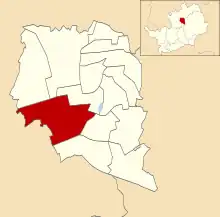
Longmeadow
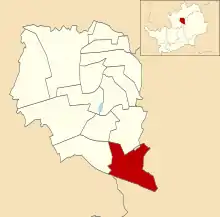
Location of Longmeadow ward
| Party | Candidate | Votes | % | |
|---|---|---|---|---|
| Labour | Sue Myson[4] | 1,298 | 64.4% | |
| Conservative | M. Davies | 412 | 20.4% | |
| Liberal Democrats | A. Dodd | 305 | 15.1% | |
| Turnout | 41.8% | |||
| Labour hold | ||||
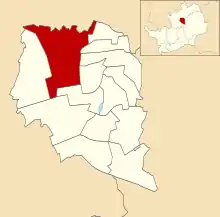
Martins Wood (2 seats)
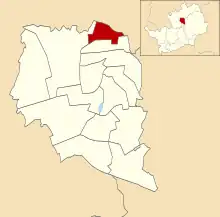
Location of Martins Wood ward
| Party | Candidate | Votes | % | |
|---|---|---|---|---|
| Labour | Lilian Strange[4] | 1,293 | ||
| Labour | S. Speller | 1,287 | ||
| Conservative | M. Mason | 455 | ||
| Conservative | E. Hegan | 409 | ||
| Liberal Democrats | B. Segadelli | 308 | ||
| Liberal Democrats | K. Taylor | 306 | ||
| Turnout | 32.6% | |||
| Labour hold | ||||
| Labour hold | ||||
Mobbsbury
Location of Mobbsbury ward
| Party | Candidate | Votes | % | |
|---|---|---|---|---|
| Labour | Tanis G.M. Kent[4] | 793 | 47.8% | |
| Liberal Democrats | R. Parker | 778 | 46.9% | |
| Conservative | S. Huetson | 87 | 5.2% | |
| Turnout | 53.1% | |||
| Labour gain from Liberal Democrats | ||||
Monkswood
Location of Monkswood ward
| Party | Candidate | Votes | % | |
|---|---|---|---|---|
| Labour | Brian Underwood[4] | 715 | 80.2% | |
| Conservative | P. Rushforth | 94 | 10.5% | |
| Liberal Democrats | G. Robbins | 83 | 9.3% | |
| Turnout | 38.5% | |||
| Labour hold | ||||
Old Stevenage
Location of Old Stevenage ward
| Party | Candidate | Votes | % | |
|---|---|---|---|---|
| Labour | David Royall[4] | 1,294 | 55.9% | |
| Conservative | J. Carter | 796 | 34.4% | |
| Liberal Democrats | J. Moorcroft | 226 | 9.8% | |
| Turnout | 41.1% | |||
| Labour gain from Conservative | ||||
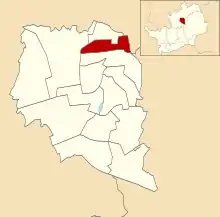
Pin Green
Location of Pin Green ward
| Party | Candidate | Votes | % | |
|---|---|---|---|---|
| Labour | D. Weston | 995 | 76.5% | |
| Liberal Democrats | S. Grubert | 162 | 12.5% | |
| Conservative | H. Poole | 143 | 11.0% | |
| Turnout | 35.6% | |||
| Labour hold | ||||
Roebuck
Location of Roebuck ward
| Party | Candidate | Votes | % | |
|---|---|---|---|---|
| Labour | Alfred McCarthy[4] | 1,006 | 73.0% | |
| Conservative | M. Hurst | 216 | 15.7% | |
| Liberal Democrats | A. Tron | 157 | 11.4% | |
| Turnout | 35.0% | |||
| Labour hold | ||||
St Nicholas
Location of St Nicholas ward
| Party | Candidate | Votes | % | |
|---|---|---|---|---|
| Labour | Richard J. Henry[4] | 728 | 54.3% | |
| Liberal Democrats | M. Griffith | 475 | 35.4% | |
| Conservative | S. Woods | 138 | 10.3% | |
| Turnout | 38.0% | |||
| Labour gain from Liberal | ||||
Shephall
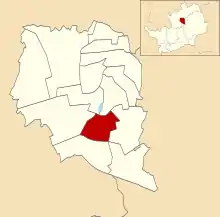
Location of Shephall ward
| Party | Candidate | Votes | % | |
|---|---|---|---|---|
| Labour | Brian P. Hall[4] | 863 | 80.9% | |
| Liberal Democrats | G. Snell | 79 | 7.4% | |
| Conservative | D. Notley | 67 | 6.3% | |
| Militant Labour | M. Evans | 58 | 5.4% | |
| Turnout | 34.1% | |||
| Labour hold | ||||
Symonds Green
Location of Symonds Green ward
| Party | Candidate | Votes | % | |
|---|---|---|---|---|
| Labour | J. Cox | 1,450 | 73.8% | |
| Conservative | R. Dimelow | 308 | 15.7% | |
| Liberal Democrats | J. Ward | 206 | 10.5% | |
| Turnout | 36.8% | |||
| Labour hold | ||||
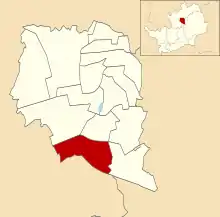
Wellfield
Location of Wellfield ward
| Party | Candidate | Votes | % | |
|---|---|---|---|---|
| Labour | Judith Wallis-Price[4] | 466 | 62.4% | |
| Liberal Democrats | M. Latham | 217 | 29.0% | |
| Conservative | L. Clark | 64 | 8.6% | |
| Turnout | 46.5% | |||
| Labour gain from Liberal | ||||
References
- ↑ "Council compositions by year". The Elections Centre.
- ↑ "Local Election Summaries 1995". The Elections Centre.
- 1 2 3 4 5 6 7 8 9 10 11 12 13 "Stevenage Borough Council Election Results 1973-2012" (PDF). Retrieved 11 July 2019.
- 1 2 3 4 5 6 7 8 9 10 11 "Members of the Council". Archived from the original on 8 November 2002. Retrieved 1 August 2019.
| Metropolitan boroughs |
|
|---|---|
| Unitary authorities |
|
| District councils |
|
| Welsh councils |
|
| Scottish councils |
|
This article is issued from Wikipedia. The text is licensed under Creative Commons - Attribution - Sharealike. Additional terms may apply for the media files.