| |||||||||||||||||||||||||||||||||||||||||||||||||||||
13 of the 39 seats to Stevenage Borough Council 20 seats needed for a majority | |||||||||||||||||||||||||||||||||||||||||||||||||||||
|---|---|---|---|---|---|---|---|---|---|---|---|---|---|---|---|---|---|---|---|---|---|---|---|---|---|---|---|---|---|---|---|---|---|---|---|---|---|---|---|---|---|---|---|---|---|---|---|---|---|---|---|---|---|
| |||||||||||||||||||||||||||||||||||||||||||||||||||||
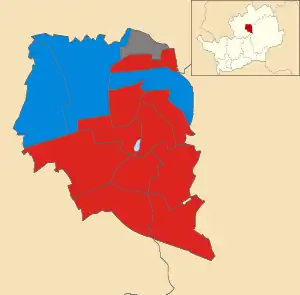 Map showing the results of contested wards in the 1992 Stevenage Borough Council elections. | |||||||||||||||||||||||||||||||||||||||||||||||||||||
| |||||||||||||||||||||||||||||||||||||||||||||||||||||
The 1992 Stevenage Borough Council election took place on 7 May 1992. This was on the same day as other local elections. One third of the council was up for election; the seats which were last contested in 1988. The Labour Party retained control of the council, which it had held continuously since its creation in 1973.
Overall results
| Party | Seats | Gains | Losses | Net gain/loss | Seats % | Votes % | Votes | +/− | ||
|---|---|---|---|---|---|---|---|---|---|---|
| Labour | 10 | 0 | 3 | 10 | 47.3 | 9,838 | ||||
| Conservative | 3 | 3 | 0 | 3 | 36.5 | 7,584 | ||||
| Liberal Democrats | 0 | 0 | 0 | 0 | 16.2 | 3,356 | ||||
| Total | 13 | 20,778 | ||||||||
| Labour hold | ||||||||||
All comparisons in seats and vote share are to the corresponding 1988 election.
Ward results
Bandley Hill
Location of Bandley Hill
| Party | Candidate | Votes | % | |
|---|---|---|---|---|
| Labour | R. Woodward | 1,037 | 56.2% | |
| Conservative | F. Warner | 609 | 33.0% | |
| Liberal Democrats | F. Price | 200 | 10.8% | |
| Turnout | 30.2% | |||
| Labour hold | ||||
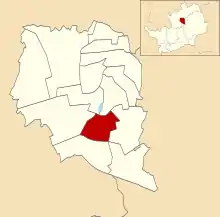
Bedwell Plash

Location of Bedwell Plash ward
| Party | Candidate | Votes | % | |
|---|---|---|---|---|
| Labour | M. Downing | 860 | 60.5% | |
| Conservative | P. Gonzalez | 461 | 32.4% | |
| Liberal Democrats | P. Windred | 100 | 7.0% | |
| Turnout | 36.4% | |||
| Labour hold | ||||
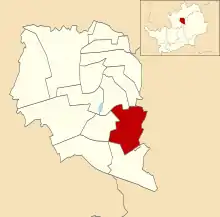
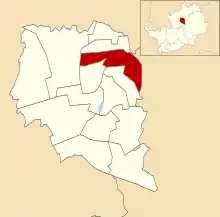
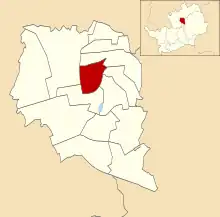
Chells
Location of Chells ward
| Party | Candidate | Votes | % | |
|---|---|---|---|---|
| Labour | K. Vale | 599 | 48.9% | |
| Conservative | G. Hegan | 388 | 31.7% | |
| Liberal Democrats | J. Wren | 237 | 19.4% | |
| Turnout | 37.8% | |||
| Labour hold | ||||
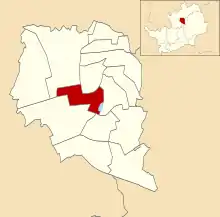
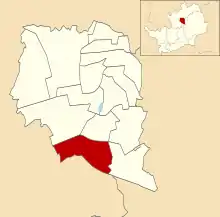
Longmeadow
Location of Longmeadow ward
| Party | Candidate | Votes | % | |
|---|---|---|---|---|
| Labour | B. Jackson | 750 | 36.8% | |
| Liberal Democrats | P. Akhurst | 725 | 35.5% | |
| Conservative | M. Hurst | 565 | 27.7% | |
| Turnout | 41.2% | |||
| Labour hold | ||||
Martins Wood
Location of Martins Wood ward
| Party | Candidate | Votes | % | |
|---|---|---|---|---|
| Conservative | D. Hawkins | 1,272 | 52.0% | |
| Labour | G. Marshall | 933 | 38.2% | |
| Liberal Democrats | K. Taylor | 240 | 9.8% | |
| Turnout | 42.6% | |||
| Conservative gain from Labour | ||||
Mobbsbury
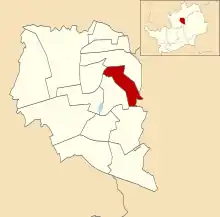
Location of Mobbsbury ward
| Party | Candidate | Votes | % | |
|---|---|---|---|---|
| Labour | R. Davies | 560 | 40.0% | |
| Liberal Democrats | R. Aitkins | 468 | 33.4% | |
| Conservative | J. Whitaker | 373 | 26.6% | |
| Turnout | 42.3% | |||
| Labour hold | ||||
Monkswood
Location of Monkswood ward
| Party | Candidate | Votes | % | |
|---|---|---|---|---|
| Labour | E. Harrington | 593 | 68.1% | |
| Conservative | M. Shaw | 187 | 21.5% | |
| Liberal Democrats | G. Robbins | 91 | 10.4% | |
| Turnout | 35.7% | |||
| Labour hold | ||||
Old Stevenage
Location of Old Stevenage ward
| Party | Candidate | Votes | % | |
|---|---|---|---|---|
| Conservative | P. McPartland | 1,243 | 53.7% | |
| Labour | M. Charney-Craw | 876 | 37.8% | |
| Liberal Democrats | A. Christy | 196 | 8.5% | |
| Turnout | 43.8% | |||
| Conservative gain from Labour | ||||
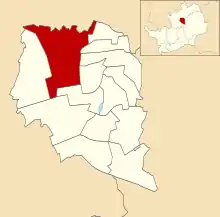
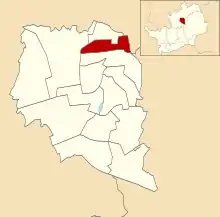
Pin Green
Location of Pin Green ward
| Party | Candidate | Votes | % | |
|---|---|---|---|---|
| Labour | J. Macfadyen | 766 | 55.6% | |
| Conservative | A. Luck | 438 | 31.8% | |
| Liberal Democrats | S. Grubert | 173 | 12.6% | |
| Turnout | 36.0% | |||
| Labour hold | ||||
Roebuck
Location of Roebuck ward
| Party | Candidate | Votes | % | |
|---|---|---|---|---|
| Labour | F. Schofield | 737 | 48.3% | |
| Conservative | H. Poole | 510 | 33.4% | |
| Liberal Democrats | P. Atkinson | 278 | 18.2% | |
| Turnout | 37.5% | |||
| Labour hold | ||||
St Nicholas
Location of St Nicholas ward
| Party | Candidate | Votes | % | |
|---|---|---|---|---|
| Labour | R. Fowler | 521 | 43.8% | |
| Conservative | S. Woods | 363 | 30.5% | |
| Liberal Democrats | A. Simister | 306 | 25.7% | |
| Turnout | 32.8% | |||
| Labour hold | ||||
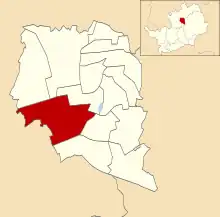
Shephall
Location of Shephall ward
| Party | Candidate | Votes | % | |
|---|---|---|---|---|
| Labour | R. Clark | 687 | 68.4% | |
| Conservative | S. Huetson | 230 | 22.9% | |
| Liberal Democrats | A. Sharman | 88 | 8.8% | |
| Turnout | 30.3% | |||
| Labour hold | ||||
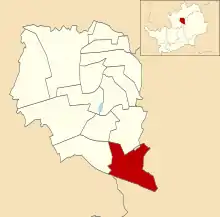
Symonds Green
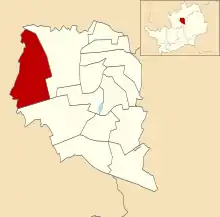
Location of Symonds Green ward
| Party | Candidate | Votes | % | |
|---|---|---|---|---|
| Conservative | M. Notley | 945 | 44.6% | |
| Labour | S. Munden | 919 | 43.4% | |
| Liberal Democrats | K. Sharman | 254 | 12.0% | |
| Turnout | 39.2% | |||
| Conservative gain from Labour | ||||
References
| Metropolitan boroughs |
|
|---|---|
| District councils (England) |
|
| District councils (Scotland) |
|
| |
This article is issued from Wikipedia. The text is licensed under Creative Commons - Attribution - Sharealike. Additional terms may apply for the media files.