| |||||||||||||||||||||||||||||||||||||||||||||||||||||
17 of 35 seats to Gosport Borough Council 18 seats needed for a majority | |||||||||||||||||||||||||||||||||||||||||||||||||||||
|---|---|---|---|---|---|---|---|---|---|---|---|---|---|---|---|---|---|---|---|---|---|---|---|---|---|---|---|---|---|---|---|---|---|---|---|---|---|---|---|---|---|---|---|---|---|---|---|---|---|---|---|---|---|
| |||||||||||||||||||||||||||||||||||||||||||||||||||||
 | |||||||||||||||||||||||||||||||||||||||||||||||||||||
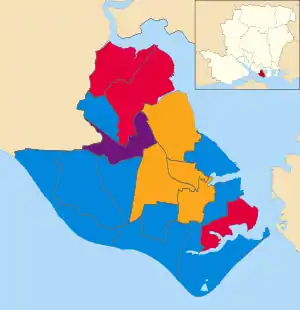
The 2014 Gosport Borough Council election took place on 22 May 2014 to elect members of Gosport Borough Council in England.[1] This was on the same day as other local elections. UKIP gained its first representation on the council, with the Labour, the Liberal Democrats, and UKIP each gaining a seat from the Conservatives; whilst they had a reduced majority, the Conservatives remained in administration.
Election Result
| Party | Seats | Gains | Losses | Net gain/loss | Seats % | Votes % | Votes | +/− | |
|---|---|---|---|---|---|---|---|---|---|
| Conservative | 9 | 0 | 3 | 46.0 | 9,651 | ||||
| Liberal Democrats | 4 | 1 | 0 | 12.8 | 2,688 | ||||
| Labour | 3 | 1 | 0 | 24.0 | 5,040 | ||||
| UKIP | 1 | 0 | 16.3 | 3,426 | |||||
| Green | 0 | 0 | 0 | 0.5 | 111 | ||||
| Independent | 0 | 0 | 0 | 0.4 | 82 | ||||
Ward Results
Alverstoke
| Party | Candidate | Votes | % | ±% | |
|---|---|---|---|---|---|
| Conservative | Peter Edgar | 1,048 | 67.91 | ||
| Labour | Jean Batterbury | 495 | 32.08 | ||
| Majority | 553 | 35.83 | |||
| Turnout | 1,543 | ||||
| Conservative hold | Swing | ||||
Anglesey
| Party | Candidate | Votes | % | ±% | |
|---|---|---|---|---|---|
| Conservative | Alan Scard | 1,059 | 81.83 | ||
| Labour | Belinda Baker | 235 | 18.16 | ||
| Majority | 824 | 63.67 | |||
| Turnout | 1,294 | ||||
| Conservative hold | Swing | ||||
Bridgemary North
| Party | Candidate | Votes | % | ±% | |
|---|---|---|---|---|---|
| Labour | Dennis Wright | 829 | 71.46 | ||
| Conservative | Lara Geddes | 331 | 28.53 | ||
| Majority | 498 | 42.93 | |||
| Turnout | 1,160 | ||||
| Labour hold | Swing | ||||
Bridgemary South
| Party | Candidate | Votes | % | ±% | |
|---|---|---|---|---|---|
| Labour | Linda Batty | 563 | 49.12 | ||
| UKIP | Adrian Tomlinson | 323 | 28.18 | ||
| Conservative | Christopher Carter | 260 | 22.68 | ||
| Majority | 240 | 20.94 | |||
| Turnout | 1,146 | ||||
| Labour gain from Conservative | Swing | ||||
Brockhurst
| Party | Candidate | Votes | % | ±% | |
|---|---|---|---|---|---|
| Liberal Democrats | Austin Hicks | 415 | 35.08 | ||
| Conservative | Diane Furlong | 292 | 24.68 | ||
| UKIP | Scott Myers | 283 | 23.92 | ||
| Labour | Alan Durrant | 111 | 9.38 | ||
| Independent | Dale Fletcher | 82 | 6.93 | ||
| Majority | 123 | 10.39 | |||
| Turnout | 1183 | ||||
| Liberal Democrats gain from Conservative | Swing | ||||
Christchurch
| Party | Candidate | Votes | % | ±% | |
|---|---|---|---|---|---|
| Conservative | Wayne Ronayne | 423 | 34.14 | ||
| Liberal Democrats | Dawn Kelly | 407 | 32.84 | ||
| UKIP | Catherine Andrews | 273 | 22.03 | ||
| Labour | Chris Noakes | 137 | 11.05 | ||
| Majority | 16 | 1.29 | |||
| Turnout | |||||
| Conservative hold | Swing | ||||
Elson
| Party | Candidate | Votes | % | ±% | |
|---|---|---|---|---|---|
| Liberal Democrats | Susan Ballard | 662 | 54.57 | ||
| Conservative | Deborah Grant | 273 | 22.5 | ||
| UKIP | Megan Parks | 218 | 18.0 | ||
| Labour | Peter Batty | 60 | 4.94 | ||
| Majority | 389 | 32.06 | |||
| Turnout | 1,213 | ||||
| Conservative hold | Swing | ||||
Forton
| Party | Candidate | Votes | % | ±% | |
|---|---|---|---|---|---|
| Liberal Democrats | Clive Foster-Reed | 334 | 35.60 | ||
| UKIP | Andrew Rice | 251 | 26.75 | ||
| Conservative | Philip Raffaelii | 208 | 22.17 | ||
| Labour | Luke Smith | 145 | 15.45 | ||
| Majority | 83 | 8.84 | |||
| Turnout | 938 | ||||
| Liberal Democrats hold | Swing | ||||
Grange
| Party | Candidate | Votes | % | ±% | |
|---|---|---|---|---|---|
| Conservative | Anthony Jessop | 359 | 48.18 | ||
| Liberal Democrats | Eduardo Goncalves | 280 | 37.58 | ||
| Labour | David Smith | 106 | 14.22 | ||
| Majority | 79 | 10.60 | |||
| Turnout | 745 | ||||
| Conservative hold | Swing | ||||
Hardway
| Party | Candidate | Votes | % | ±% | |
|---|---|---|---|---|---|
| Conservative | Roger Allen | 857 | 69.67 | ||
| Labour | Robin Young | 373 | 30.32 | ||
| Majority | 484 | 64.96 | |||
| Turnout | 745 | ||||
| Labour hold | Swing | ||||
Lee East
| Party | Candidate | Votes | % | ±% | |
|---|---|---|---|---|---|
| Conservative | Richard Batemann | 997 | 61.35 | ||
| UKIP | Lavinia Seymour | 362 | 22.27 | ||
| Labour | James Fox | 155 | 9.53 | ||
| Green | Graham Smith | 111 | 6.83 | ||
| Majority | 635 | 39.07 | |||
| Turnout | 1,625 | ||||
| Conservative hold | Swing | ||||
Lee West
| Party | Candidate | Votes | % | ±% | |
|---|---|---|---|---|---|
| Conservative | Christopher Carter | 1,251 | 67.76 | ||
| UKIP | John Semour | 373 | 20.20 | ||
| Labour | Jill Whitcher | 222 | 12.02 | ||
| Majority | 878 | 47.56 | |||
| Turnout | 1,846 | ||||
| Conservative hold | Swing | ||||
Leesland
| Party | Candidate | Votes | % | ±% | |
|---|---|---|---|---|---|
| Liberal Democrats | Peter Chegwyn | 590 | 54.12 | ||
| Conservative | Zoe Chegwyn | 367 | 33.66 | ||
| Labour | Michael Madgwick | 133 | 12.20 | ||
| Majority | 223 | 20.45 | |||
| Turnout | 1,090 | ||||
| Liberal Democrats hold | Swing | ||||
Peel Common
| Party | Candidate | Votes | % | ±% | |
|---|---|---|---|---|---|
| Conservative | Lynn Hook | 689 | 50.08 | ||
| UKIP | Paul Tomlinson | 391 | 31.73 | ||
| Labour | Martyn Davis | 224 | 18.18 | ||
| Majority | 226 | 18.34 | |||
| Turnout | 1,232 | ||||
| Conservative hold | Swing | ||||
Privett
| Party | Candidate | Votes | % | ±% | |
|---|---|---|---|---|---|
| Conservative | Ingeborg Forder | 725 | 57.08 | ||
| UKIP | Timothy Apps | 349 | 27.48 | ||
| Labour | Terance Robbins | 196 | 15.43 | ||
| Majority | 376 | 29.60 | |||
| Turnout | 1,270 | ||||
| Conservative hold | Swing | ||||
Rowner and Holbrook
| Party | Candidate | Votes | % | ±% | |
|---|---|---|---|---|---|
| UKIP | Patrick Bergin | 320 | 35.51 | ||
| Conservative | Natasha Hook | 317 | 35.18 | ||
| Labour | Kyle Allen | 264 | 29.30 | ||
| Majority | 3 | 0.33 | |||
| Turnout | 901 | ||||
| UKIP gain from Conservative | Swing | ||||
Town
| Party | Candidate | Votes | % | ±% | |
|---|---|---|---|---|---|
| Labour | Jane Cully | 792 | 59.01 | ||
| UKIP | David Tinman | 283 | 21.08 | ||
| Conservative | George McAleese | 267 | 19.89 | ||
| Majority | 509 | 37.92 | |||
| Turnout | 1,342 | ||||
| Labour hold | Swing | ||||
References
- ↑ "England council results". BBC News. Retrieved 23 May 2014.
This article is issued from Wikipedia. The text is licensed under Creative Commons - Attribution - Sharealike. Additional terms may apply for the media files.