| |||||||||||||||||||||||||||||||||||||||||||||||||||||||||||||||||||||||||||||
23 of 66 seats (One Third and one by-election) to Wirral Metropolitan Borough Council 34 seats needed for a majority | |||||||||||||||||||||||||||||||||||||||||||||||||||||||||||||||||||||||||||||
|---|---|---|---|---|---|---|---|---|---|---|---|---|---|---|---|---|---|---|---|---|---|---|---|---|---|---|---|---|---|---|---|---|---|---|---|---|---|---|---|---|---|---|---|---|---|---|---|---|---|---|---|---|---|---|---|---|---|---|---|---|---|---|---|---|---|---|---|---|---|---|---|---|---|---|---|---|---|
| Turnout | 35.6% ( | ||||||||||||||||||||||||||||||||||||||||||||||||||||||||||||||||||||||||||||
| |||||||||||||||||||||||||||||||||||||||||||||||||||||||||||||||||||||||||||||
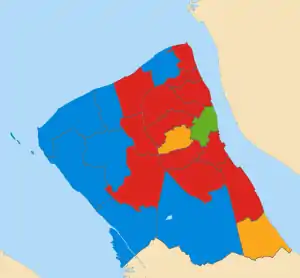 Map of results of 2014 election | |||||||||||||||||||||||||||||||||||||||||||||||||||||||||||||||||||||||||||||
| |||||||||||||||||||||||||||||||||||||||||||||||||||||||||||||||||||||||||||||
The 2014 Wirral Metropolitan Borough Council election took place on 22 May 2014 to elect members of Wirral Metropolitan Borough Council in England.[1] This election was held on the same day as other local elections.
After the election, the composition of the council was:
| Party | Seats | ± | |
|---|---|---|---|
| Labour | 38 | ||
| Conservative | 21 | ||
| Liberal Democrat | 6 | ||
| Green | 1 | ||
| Independent | 0 | ||
Election results
Overall election result
Overall result compared with 2012.
| Wirral Metropolitan Borough Council election result, 2014 | |||||||||||||||
|---|---|---|---|---|---|---|---|---|---|---|---|---|---|---|---|
| Party | Candidates | Votes | |||||||||||||
| Stood | Elected | Gained | Unseated | Net | % of total | % | No. | Net % | |||||||
| Labour | 23 | 12 | 2 | 1 | 54.5 | 38.6 | 33,145 | ||||||||
| Conservative | 23 | 8 | 0 | 1 | 31.8 | 28.0 | 24,105 | ||||||||
| UKIP | 22 | 0 | 0 | 0 | 0.0 | 17.2 | 14,793 | ||||||||
| Green | 22 | 1 | 1 | 0 | 4.5 | 8.0 | 6,835 | ||||||||
| Liberal Democrats | 18 | 2 | 0 | 0 | 9.1 | 7.8 | 6,728 | ||||||||
| Independent | 3 | 0 | 0 | 1 | 0.0 | 0.3 | 239 | ||||||||
| TUSC | 2 | 0 | 0 | 0 | 0.0 | 0.1 | 91 | ||||||||
Changes in council composition
Prior to the election the composition of the council was:
| 37 | 22 | 6 | 1 |
| Lab | Con | LD | I |
After the election the composition of the council was:
| 38 | 21 | 6 | 1 |
| Lab | Con | LD | G |
Ward results
Results compared directly with the last local election in 2012.
Bebington
| Party | Candidate | Votes | % | ±% | |
|---|---|---|---|---|---|
| Labour | Walter Smith | 2,165 | 48.7 | ||
| Conservative | Des Drury | 1,013 | 22.8 | ||
| UKIP | Hilary Jones | 873 | 19.6 | ||
| Green | Anthony Smith | 289 | 6.5 | ||
| Liberal Democrats | Peter Faulkner | 110 | 2.5 | ||
| Majority | 1,152 | 25.9 | |||
| Registered electors | 11,956 | ||||
| Turnout | 37.3 | ||||
| Labour hold | Swing | ||||
Bidston and St James
| Party | Candidate | Votes | % | ±% | |
|---|---|---|---|---|---|
| Labour | Ann McLachlan | 1,701 | 64.6 | ||
| UKIP | Cathy Williams | 540 | 20.5 | ||
| Conservative | Geoffrey Dormant | 190 | 7.2 | ||
| Green | Colin Dignam-Gill | 106 | 4.0 | ||
| Liberal Democrats | Roy Wood | 53 | 2.0 | ||
| TUSC | Greg North | 43 | 1.6 | New | |
| Majority | 1,161 | 44.1 | |||
| Registered electors | 9,932 | ||||
| Turnout | 26.6 | ||||
| Labour hold | Swing | ||||
Birkenhead and Tranmere
| Party | Candidate | Votes | % | ±% | |
|---|---|---|---|---|---|
| Green | Pat Cleary | 1,658 | 47.6 | ||
| Labour | Brian Kenny | 1,421 | 40.8 | ||
| UKIP | Laurence Sharpe-Stevens | 334 | 9.6 | ||
| Conservative | June Cowin | 69 | 2.0 | ||
| Majority | 237 | 6.8 | N/A | ||
| Registered electors | 9,882 | ||||
| Turnout | 35.4 | ||||
| Green gain from Labour | Swing | ||||
Bromborough
| Party | Candidate | Votes | % | ±% | |
|---|---|---|---|---|---|
| Labour | Irene Williams | 1,709 | 49.9 | ||
| UKIP | Sue Colquhoun | 772 | 22.6 | ||
| Conservative | Peter Taylor | 469 | 13.7 | ||
| Liberal Democrats | Penelope Golby | 247 | 7.2 | ||
| Green | Percy Hogg | 225 | 6.6 | ||
| Majority | 937 | 27.3 | |||
| Majority | 1,152 | 25.9 | |||
| Registered electors | 11,312 | ||||
| Turnout | 30.4 | ||||
| Labour hold | Swing | ||||
Clatterbridge
| Party | Candidate | Votes | % | ±% | |
|---|---|---|---|---|---|
| Conservative | Tracey Smith | 1,911 | 40.6 | ||
| Labour | Jenny Holliday | 1,491 | 31.6 | ||
| UKIP | Roger Jones | 802 | 17.0 | ||
| Liberal Democrats | Matthew Donnelly | 266 | 5.6 | ||
| Green | Colin Thompson | 241 | 5.1 | ||
| Majority | 420 | 9.0 | |||
| Registered electors | 11,684 | ||||
| Turnout | 40.5 | ||||
| Conservative hold | Swing | ||||
Claughton
| Party | Candidate | Votes | % | ±% | |
|---|---|---|---|---|---|
| Labour | Denise Roberts | 1,912 | 53.3 | ||
| UKIP | Philip Griffiths | 760 | 21.2 | ||
| Conservative | Barbara Sinclair | 522 | 14.5 | ||
| Green | Paul Cartlidge | 222 | 6.2 | ||
| Liberal Democrats | Chris Teggin | 172 | 4.8 | ||
| Majority | 1,152 | 32.1 | |||
| Registered electors | 11,184 | ||||
| Turnout | 32.2 | ||||
| Labour hold | Swing | ||||
Eastham
| Party | Candidate | Votes | % | ±% | |
|---|---|---|---|---|---|
| Liberal Democrats | Chris Carubia | 1,558 | 39.5 | ||
| Labour | Mike Thompson | 1,180 | 29.9 | ||
| UKIP | Ryan Bingham | 592 | 15.0 | ||
| Conservative | Keith Jack | 469 | 11.9 | ||
| Green | Oliver Downing | 147 | 3.7 | ||
| Majority | 378 | 9.6 | |||
| Registered electors | 10,889 | ||||
| Turnout | 36.4 | ||||
| Liberal Democrats hold | Swing | ||||
Greasby, Frankby and Irby
| Party | Candidate | Votes | % | ±% | |
|---|---|---|---|---|---|
| Conservative | Wendy Clements [n 2] | 2,193 | 38.6 | ||
| Conservative | Tom Anderson [n 3] | 1,687 | – | – | |
| Labour | Julie McManus | 1,186 | 20.9 | ||
| Liberal Democrats | Peter Reisdorf | 1,076 | 19.0 | ||
| Labour | Lee Rushworth | 838 | – | – | |
| Liberal Democrats | John Creswell | 749 | – | – | |
| UKIP | Derek Snowden | 809 | 14.3 | ||
| Green | Rachel Markey | 208 | 7.3 | ||
| Majority | 1,007 | 17.7 | |||
| Registered electors | 11,501 | ||||
| Turnout | 43.0 | ||||
| Conservative hold | Swing | ||||
| Conservative hold | Swing | – | |||
Heswall
| Party | Candidate | Votes | % | ±% | |
|---|---|---|---|---|---|
| Conservative | Les Rowlands | 2,398 | 55.7 | ||
| UKIP | David Scott | 773 | 17.9 | ||
| Labour | Mike Holliday | 668 | 15.5 | ||
| Green | Barbara Burton | 277 | 6.4 | ||
| Liberal Democrats | David Tyrrell | 191 | 4.4 | ||
| Majority | 1,625 | 37.8 | |||
| Registered electors | 10,894 | ||||
| Turnout | 39.7 | ||||
| Conservative hold | Swing | ||||
Hoylake and Meols
| Party | Candidate | Votes | % | ±% | |
|---|---|---|---|---|---|
| Conservative | Eddie Boult | 1,912 | 46.7 | ||
| Labour | Pat Glasman [n 4] | 1,075 | 26.2 | ||
| UKIP | George Robinson | 531 | 13.0 | ||
| Green | Yvonne McGinley | 423 | 10.3 | ||
| Liberal Democrats | Joseph McDowell | 155 | 3.8 | ||
| Majority | 837 | 20.5 | |||
| Registered electors | 10,403 | ||||
| Turnout | 39.5 | ||||
| Conservative hold | Swing | ||||
Leasowe and Moreton East
| Party | Candidate | Votes | % | ±% | |
|---|---|---|---|---|---|
| Labour | Treena Johnson | 1,819 | 45.5 | ||
| Conservative | Ian Lewis | 1,633 | 40.8 | ||
| UKIP | Frank Whitham | 433 | 10.8 | ||
| Green | David Dubost | 116 | 2.9 | ||
| Majority | 186 | 4.7 | |||
| Registered electors | 10,691 | ||||
| Turnout | 37.5 | ||||
| Labour gain from Conservative | Swing | ||||
Liscard
| Party | Candidate | Votes | % | ±% | |
|---|---|---|---|---|---|
| Labour | Matthew Daniel | 1,619 | 46.9 | ||
| UKIP | Lynda Williams | 815 | 23.6 | ||
| Conservative | Ann Lavin | 649 | 18.8 | ||
| Green | Craig Reynolds | 273 | 7.9 | ||
| Liberal Democrats | Daniel Clein | 94 | 2.7 | New | |
| Majority | 804 | 23.3 | |||
| Registered electors | 11,120 | ||||
| Turnout | 31.2 | ||||
| Labour hold | Swing | ||||
Moreton West and Saughall Massie
| Party | Candidate | Votes | % | ±% | |
|---|---|---|---|---|---|
| Conservative | Bruce Berry | 1,817 | 43.9 | ||
| Labour | Karl Greaney | 1,484 | 35.9 | ||
| UKIP | Susan Whitham | 678 | 16.4 | ||
| Green | Perle Sheldricks | 160 | 3.9 | ||
| Majority | 333 | 8.0 | |||
| Registered electors | 10,885 | ||||
| Turnout | 38.1 | ||||
| Conservative hold | Swing | ||||
New Brighton
| Party | Candidate | Votes | % | ±% | |
|---|---|---|---|---|---|
| Labour | Christine Spriggs | 1,658 | 42.3 | ||
| Conservative | Tony Pritchard | 1,348 | 34.4 | ||
| UKIP | John Brown | 492 | 12.6 | ||
| Green | John Howe | 418 | 10.7 | ||
| Majority | 310 | 7.9 | |||
| Registered electors | 10,823 | ||||
| Turnout | 36.3 | ||||
| Labour hold | Swing | ||||
Oxton
| Party | Candidate | Votes | % | ±% | |
|---|---|---|---|---|---|
| Liberal Democrats | Alan Brighouse | 1,620 | 38.3 | ||
| Labour | Angela Davies | 1,483 | 35.1 | ||
| UKIP | David Martin | 563 | 13.3 | ||
| Conservative | Peter Hartley | 310 | 7.3 | ||
| Green | Liz Heydon | 250 | 5.9 | ||
| Majority | 137 | 3.2 | |||
| Registered electors | 11,281 | ||||
| Turnout | 37.5 | ||||
| Liberal Democrats hold | Swing | ||||
Pensby and Thingwall
| Party | Candidate | Votes | % | ±% | |
|---|---|---|---|---|---|
| Labour | Louise Reecejones | 1,334 | 32.6 | ||
| Conservative | Denis Knowles | 1,172 | 28.7 | ||
| UKIP | Jan Davison | 916 | 22.4 | ||
| Liberal Democrats | Damien Cummins | 390 | 9.5 | ||
| Green | Allen Burton | 274 | 6.7 | ||
| Majority | 162 | 4.0 | |||
| Registered electors | 10,520 | ||||
| Turnout | 39.0 | ||||
| Labour gain from Independent | Swing | ||||
Prenton
| Party | Candidate | Votes | % | ±% | |
|---|---|---|---|---|---|
| Labour | Denise Realey | 1,731 | 47.0 | ||
| UKIP | James Bradshaw | 802 | 21.8 | ||
| Conservative | Hilary Jones | 578 | 15.7 | ||
| Liberal Democrats | Allan Brame | 310 | 8.4 | ||
| Green | Moira Gommon | 265 | 7.2 | ||
| Majority | 929 | 25.2 | |||
| Registered electors | 10,820 | ||||
| Turnout | 34.2 | ||||
| Labour hold | Swing | ||||
Rock Ferry
| Party | Candidate | Votes | % | ±% | |
|---|---|---|---|---|---|
| Labour | Moira McLaughlin | 1,478 | 58.1 | ||
| UKIP | Ann Flynn | 531 | 20.9 | ||
| Conservative | Barbara Poole | 195 | 7.7 | ||
| Green | Karl Cumings | 164 | 6.4 | ||
| Liberal Democrats | Brian Hall | 64 | 2.5 | ||
| Independent | James Pritchard | 64 | 2.5 | ||
| TUSC | Clay Brady | 48 | 1.9 | ||
| Majority | 947 | 37.2 | |||
| Registered electors | 9,654 | ||||
| Turnout | 26.5 | ||||
| Labour hold | Swing | ||||
Seacombe
| Party | Candidate | Votes | % | ±% | |
|---|---|---|---|---|---|
| Labour | Adrian Jones | 1,616 | 59.2 | ||
| UKIP | Christopher Wellstead | 688 | 25.2 | ||
| Conservative | Suzanne Sheppick | 211 | 7.7 | ||
| Green | Jayne Clough | 162 | 5.9 | ||
| Independent | Karl Mercer | 53 | 1.9 | New | |
| Majority | 928 | 34.0 | |||
| Registered electors | 10,286 | ||||
| Turnout | 26.7 | ||||
| Labour hold | Swing | ||||
Upton
| Party | Candidate | Votes | % | ±% | |
|---|---|---|---|---|---|
| Labour | Stuart Whittingham | 1,932 | 48.8 | ||
| UKIP | Geoffrey Caton | 942 | 23.8 | ||
| Conservative | Geoffrey Gubb | 760 | 19.2 | ||
| Green | Jim McGinley | 206 | 5.2 | ||
| Liberal Democrats | Alan Davies | 117 | 3.0 | ||
| Majority | 990 | 25.0 | |||
| Registered electors | 12,101 | ||||
| Turnout | 32.9 | ||||
| Labour hold | Swing | ||||
Wallasey
| Party | Candidate | Votes | % | ±% | |
|---|---|---|---|---|---|
| Conservative | Lesley Rennie | 2,216 | 48.8 | ||
| Labour | Paul Ronayne | 1,291 | 28.5 | ||
| UKIP | Brian Farrell | 594 | 13.1 | ||
| Green | Cynthia Stonall | 288 | 6.3 | ||
| Liberal Democrats | John Codling | 148 | 3.3 | New | |
| Majority | 925 | 20.3 | |||
| Registered electors | 11,752 | ||||
| Turnout | 38.7 | ||||
| Conservative hold | Swing | ||||
West Kirby and Thurstaston
| Party | Candidate | Votes | % | ±% | |
|---|---|---|---|---|---|
| Conservative | Jeff Green | 2,070 | 47.6 | ||
| Labour | Helen Campbell | 1,192 | 27.4 | ||
| UKIP | David Evennett | 553 | 12.7 | ||
| Green | Shirley Johnson | 259 | 5.9 | ||
| Liberal Democrats | Mike Redfern | 157 | 3.6 | ||
| Independent | Charles Barnes | 122 | 2.8 | ||
| Majority | 878 | 20.2 | |||
| Registered electors | 10,365 | ||||
| Turnout | 42.2 | ||||
| Conservative hold | Swing | ||||
Notes
- ↑ % of total refers to % of wards won.
- ↑ Elected to serve a 4-year term.
- ↑ Elected to serve a 2-year term.
- ↑ Incumbent councillor for New Brighton ward.
• italics denote the sitting councillor • bold denotes the winning candidate
References
- 1 2 3 "Election Result for 22 May 2014 Summary". Wirral Metropolitan Borough Council.
- ↑ "Local Election Results 2014 Wirral". Local Elections Archive Project.
- ↑ "Election Result for Bebington ward on 22 May 2014". Wirral Metropolitan Borough Council.
- ↑ "Councillor Walter Smith". Wirral Metropolitan Borough Council. Archived from the original on 12 June 2018. Retrieved 20 May 2018.
- ↑ "Election Result for Bidston and St James ward on 22 May 2014". Wirral Metropolitan Borough Council.
- ↑ "Councillor Ann McLachlan". Wirral Metropolitan Borough Council. Archived from the original on 12 June 2018. Retrieved 20 May 2018.
- ↑ "Election Result for Birkenhead and Tranmere ward on 22 May 2014". Wirral Metropolitan Borough Council.
- ↑ "Councillor Pat Cleary". Wirral Metropolitan Borough Council. 4 July 2023.
- ↑ "Councillor Brian Kenny". Wirral Metropolitan Borough Council. Archived from the original on 12 June 2018. Retrieved 21 May 2018.
- ↑ "Election Result for Bromborough ward on 22 May 2014". Wirral Metropolitan Borough Council.
- ↑ "Councillor Irene Williams". Wirral Metropolitan Borough Council. Archived from the original on 21 May 2018. Retrieved 20 May 2018.
- ↑ "Election Result for Clatterbridge ward on 22 May 2014". Wirral Metropolitan Borough Council.
- ↑ "Councillor Tracey Pilgrim". Wirral Metropolitan Borough Council.
- ↑ "Election Result for Claughton ward on 22 May 2014". Wirral Metropolitan Borough Council.
- ↑ "Councillor Denise Roberts". Wirral Metropolitan Borough Council. Archived from the original on 12 June 2018. Retrieved 20 May 2018.
- ↑ "Election Result for Eastham ward on 22 May 2014". Wirral Metropolitan Borough Council.
- ↑ "Councillor Chris Carubia". Wirral Metropolitan Borough Council. 4 July 2023.
- ↑ "Election Result for Greasby, Frankby and Irby ward on 22 May 2014". Wirral Metropolitan Borough Council.
- ↑ "Councillor Wendy Clements". Wirral Metropolitan Borough Council. Archived from the original on 21 May 2018. Retrieved 20 May 2018.
- ↑ "Councillor Tom Anderson". Wirral Metropolitan Borough Council. Archived from the original on 21 May 2018. Retrieved 20 May 2018.
- ↑ "Councillor Julie McManus". Wirral Metropolitan Borough Council. 4 July 2023.
- ↑ "Councillor Peter Reisdorf". Wirral Metropolitan Borough Council. Archived from the original on 12 June 2018. Retrieved 20 May 2018.
- ↑ "Election Result for Heswall ward on 22 May 2014". Wirral Metropolitan Borough Council.
- ↑ "Councillor Les Rowlands". Wirral Metropolitan Borough Council. Archived from the original on 12 June 2018. Retrieved 20 May 2018.
- ↑ "Election Result for Hoylake and Meols ward on 22 May 2014". Wirral Metropolitan Borough Council.
- ↑ "Councillor Eddie Boult". Wirral Metropolitan Borough Council.
- ↑ "Councillor Patricia Glasman". Wirral Metropolitan Borough Council.
- ↑ "Election Result for Leasowe and Moreton East ward on 22 May 2014". Wirral Metropolitan Borough Council.
- ↑ "Councillor Treena Johnson". Wirral Metropolitan Borough Council.
- ↑ "Councillor Ian Lewis". Wirral Metropolitan Borough Council. 4 July 2023.
- ↑ "Election Result for Liscard ward on 22 May 2014". Wirral Metropolitan Borough Council.
- ↑ "Election Result for Moreton West and Saughall Massie ward on 22 May 2014". Wirral Metropolitan Borough Council.
- ↑ "Councillor Bruce Berry". Wirral Metropolitan Borough Council.
- ↑ "Election Result for New Brighton ward on 22 May 2014". Wirral Metropolitan Borough Council.
- ↑ "Councillor Christine Spriggs". Wirral Metropolitan Borough Council.
- ↑ "Councillor Tony Pritchard". Wirral Metropolitan Borough Council. Archived from the original on 12 June 2018. Retrieved 21 May 2018.
- ↑ "Election Result for Oxton ward on 22 May 2014". Wirral Metropolitan Borough Council.
- ↑ "Councillor Alan Brighouse". Wirral Metropolitan Borough Council. Archived from the original on 12 June 2018. Retrieved 21 May 2018.
- ↑ "Councillor Angela Davies". Wirral Metropolitan Borough Council. 4 July 2023.
- ↑ "Election Result for Pensby and Thingwall ward on 22 May 2014". Wirral Metropolitan Borough Council.
- ↑ "Councillor Louise Reecejones". Wirral Metropolitan Borough Council.
- ↑ "Councillor Denis Knowles". Wirral Metropolitan Borough Council. Archived from the original on 12 June 2018. Retrieved 21 May 2018.
- ↑ "Election Result for Prenton ward on 22 May 2014". Wirral Metropolitan Borough Council.
- ↑ "Councillor Denise Realey". Wirral Metropolitan Borough Council. Archived from the original on 12 June 2018. Retrieved 21 May 2018.
- ↑ "Councillor Allan Brame". Wirral Metropolitan Borough Council. 4 July 2023.
- ↑ "Election Result for Rock Ferry ward on 22 May 2014". Wirral Metropolitan Borough Council.
- ↑ "Councillor Moira McLaughlin". Wirral Metropolitan Borough Council. Archived from the original on 12 June 2018. Retrieved 21 May 2018.
- ↑ "Election Result for Seacombe ward on 22 May 2014". Wirral Metropolitan Borough Council.
- ↑ "Councillor Adrian Jones". Wirral Metropolitan Borough Council. Archived from the original on 12 June 2018. Retrieved 22 May 2018.
- ↑ "Election Result for Upton ward on 22 May 2014". Wirral Metropolitan Borough Council.
- ↑ "Councillor Stuart Whittingham". Wirral Metropolitan Borough Council.
- ↑ "Election Result for Wallasey ward on 22 May 2014". Wirral Metropolitan Borough Council.
- ↑ "Councillor Lesley Rennie". Wirral Metropolitan Borough Council.
- ↑ "Election Result for West Kirby and Thurstaston ward on 22 May 2014". Wirral Metropolitan Borough Council.
- ↑ "Councillor Jeff Green". Wirral Metropolitan Borough Council.
This article is issued from Wikipedia. The text is licensed under Creative Commons - Attribution - Sharealike. Additional terms may apply for the media files.