Lamoura | |
|---|---|
_-_Mairie.JPG.webp) Town hall | |
Location of Lamoura | |
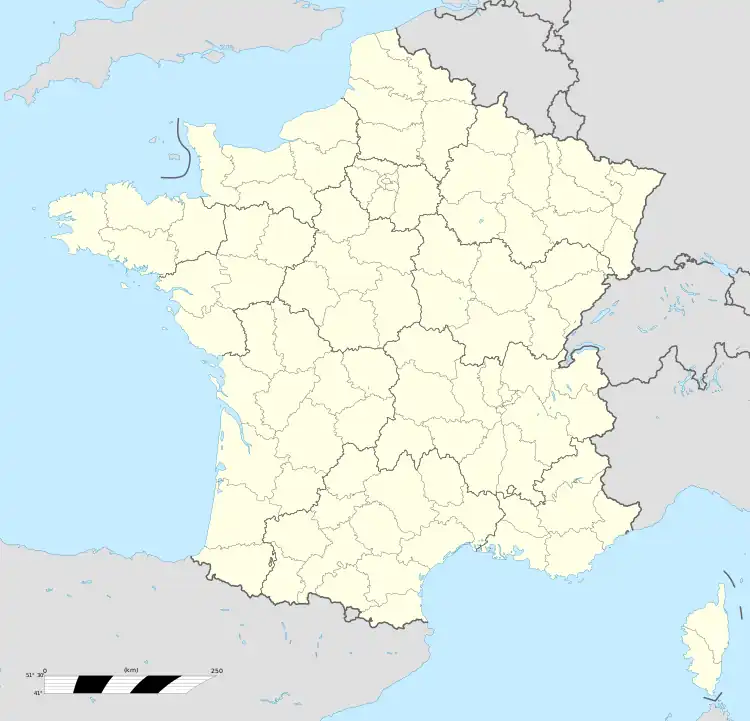 Lamoura 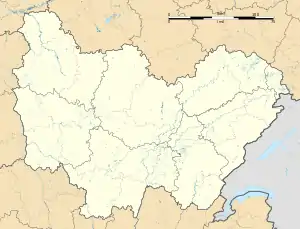 Lamoura | |
| Coordinates: 46°23′46″N 5°58′03″E / 46.3961°N 5.9675°E | |
| Country | France |
| Region | Bourgogne-Franche-Comté |
| Department | Jura |
| Arrondissement | Saint-Claude |
| Canton | Coteaux du Lizon |
| Government | |
| • Mayor (2020–2026) | Francis Leseur[1] |
| Area 1 | 22.28 km2 (8.60 sq mi) |
| Population | 654 |
| • Density | 29/km2 (76/sq mi) |
| Time zone | UTC+01:00 (CET) |
| • Summer (DST) | UTC+02:00 (CEST) |
| INSEE/Postal code | 39275 /39310 |
| Elevation | 1,064–1,495 m (3,491–4,905 ft) |
| 1 French Land Register data, which excludes lakes, ponds, glaciers > 1 km2 (0.386 sq mi or 247 acres) and river estuaries. | |
Lamoura is a commune in the Jura department in Bourgogne-Franche-Comté in eastern France.[3]
Climate
| Climate data for Lamoura (1981–2010 averages): elevation 1124m | |||||||||||||
|---|---|---|---|---|---|---|---|---|---|---|---|---|---|
| Month | Jan | Feb | Mar | Apr | May | Jun | Jul | Aug | Sep | Oct | Nov | Dec | Year |
| Mean daily maximum °C (°F) | 3.1 (37.6) |
3.7 (38.7) |
6.5 (43.7) |
9.7 (49.5) |
14.5 (58.1) |
17.9 (64.2) |
20.7 (69.3) |
20.3 (68.5) |
16.5 (61.7) |
12.7 (54.9) |
6.7 (44.1) |
3.7 (38.7) |
11.3 (52.4) |
| Daily mean °C (°F) | −1.2 (29.8) |
−1 (30) |
1.7 (35.1) |
4.8 (40.6) |
9.3 (48.7) |
12.4 (54.3) |
15.0 (59.0) |
14.7 (58.5) |
11.2 (52.2) |
7.9 (46.2) |
2.5 (36.5) |
−0.2 (31.6) |
6.4 (43.5) |
| Mean daily minimum °C (°F) | −5.6 (21.9) |
−5.7 (21.7) |
−3.1 (26.4) |
−0.2 (31.6) |
4.2 (39.6) |
6.9 (44.4) |
9.2 (48.6) |
9.0 (48.2) |
6.0 (42.8) |
3.2 (37.8) |
−1.6 (29.1) |
−4.1 (24.6) |
1.5 (34.7) |
| Average precipitation mm (inches) | 179.7 (7.07) |
163.4 (6.43) |
163.3 (6.43) |
151.4 (5.96) |
172.1 (6.78) |
162.9 (6.41) |
148.7 (5.85) |
147.6 (5.81) |
162.9 (6.41) |
184.7 (7.27) |
185.5 (7.30) |
193.4 (7.61) |
2,015.6 (79.33) |
| Source: Meteociel[4] | |||||||||||||
Population
| Year | Pop. | ±% p.a. |
|---|---|---|
| 1968 | 215 | — |
| 1975 | 333 | +6.45% |
| 1982 | 379 | +1.87% |
| 1990 | 388 | +0.29% |
| 1999 | 436 | +1.30% |
| 2009 | 536 | +2.09% |
| 2014 | 594 | +2.08% |
| 2020 | 648 | +1.46% |
| Source: INSEE[5] | ||
See also
References
- ↑ "Répertoire national des élus: les maires". data.gouv.fr, Plateforme ouverte des données publiques françaises (in French). 2 December 2020.
- ↑ "Populations légales 2021". The National Institute of Statistics and Economic Studies. 28 December 2023.
- ↑ INSEE commune file
- ↑ "Normales et records pour Lamoura (39)". Meteociel. Retrieved 17 September 2023.
- ↑ Population en historique depuis 1968, INSEE
Wikimedia Commons has media related to Lamoura.
This article is issued from Wikipedia. The text is licensed under Creative Commons - Attribution - Sharealike. Additional terms may apply for the media files.