| ||
|
| ||
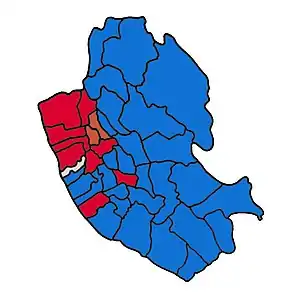 Map of Liverpool showing wards won (first placed party)[1] | ||
Elections to Liverpool City Council were held on 1 November 1947. This was the last local election held at the beginning of November.
After the election, the composition of the council was:
| Party | Councillors | ± | Aldermen | Total | |
|---|---|---|---|---|---|
| Conservative | ?? | ?? | ?? | ?? | |
| Labour | ?? | ?? | ?? | ?? | |
| Protestant | ?? | ?? | ?? | ?? | |
| Liberal | ?? | ?? | ?? | ?? | |
Election result
| Party | Seats | Gains | Losses | Net gain/loss | Seats % | Votes % | Votes | +/− | |
|---|---|---|---|---|---|---|---|---|---|
| Conservative | 28 | 58% | 144,371 | ||||||
| Labour | 9 | 39% | 98,200 | ||||||
| Protestant | 2 | 2% | 5,782 | ||||||
| Independent | 1 | 0.49% | 1,216 | ||||||
| Liberal | 0 | 0% | 0.21% | 527 | |||||
| Communist | 0 | 0% | 0.20% | 499 | |||||
Ward results
* - Councillor seeking re-election
(PARTY) - Party of former Councillor
Due to the disruption in elections caused by The Second World War no comparisons are made with other elections.
Abercromby
| Party | Candidate | Votes | % | ±% | |
|---|---|---|---|---|---|
| Conservative | Francis Joseph Bullen | 3,160 | 54% | ||
| Labour | Harry Livermore | 2,689 | 46% | ||
| Majority | 471 | ||||
| Registered electors | 14,189 | ||||
| Turnout | 5,849 | 41% | |||
Aigburth
| Party | Candidate | Votes | % | ±% | |
|---|---|---|---|---|---|
| Conservative | Herbert M. Allen | 7,871 | 83% | ||
| Labour | William Firman Aldis | 1,604 | 17% | ||
| Majority | 6,267 | ||||
| Registered electors | 16,307 | ||||
| Turnout | 9,475 | 58% | |||
Allerton
| Party | Candidate | Votes | % | ±% | |
|---|---|---|---|---|---|
| Conservative | Mrs Margaret J. Strong | 3,817 | 68% | ||
| Labour | Mrs. Edith Evans | 1,306 | 23% | ||
| Liberal | Herbert Griffith Edwards | 527 | 9% | ||
| Majority | 2,511 | ||||
| Registered electors | 9,853 | ||||
| Turnout | 5,650 | 57% | |||
Anfield
| Party | Candidate | Votes | % | ±% | |
|---|---|---|---|---|---|
| Conservative | Albert Joseph White | 5,964 | 64% | ||
| Labour | Richard Clitherow | 3,288 | 36% | ||
| Majority | 2,676 | ||||
| Registered electors | 17,429 | ||||
| Turnout | 9,252 | 53% | |||
Breckfield
| Party | Candidate | Votes | % | ±% | |
|---|---|---|---|---|---|
| Conservative | David Jean Lewis | 4,086 | 60% | ||
| Labour | John Hamilton | 2,681 | 40% | ||
| Majority | 1,405 | ||||
| Registered electors | 13,209 | ||||
| Turnout | 6,767 | 51% | |||
Brunswick
| Party | Candidate | Votes | % | ±% | |
|---|---|---|---|---|---|
| Labour | Frank Hampton Cain | 2,360 | 75% | ||
| Conservative | William Henry Beavan | 695 | 22% | ||
| Communist | Albert Southern | 83 | 3% | ||
| Majority | 1,665 | ||||
| Registered electors | 13,209 | ||||
| Turnout | 3,138 | 24% | |||
Castle Street
| Party | Candidate | Votes | % | ±% | |
|---|---|---|---|---|---|
| Conservative | James Bennett | unopposed | |||
Childwall
| Party | Candidate | Votes | % | ±% | |
|---|---|---|---|---|---|
| Conservative | Alexander Young | 5,914 | 82% | ||
| Labour | William Hamling | 1,341 | 18% | ||
| Majority | 4,573 | ||||
| Registered electors | 13,198 | ||||
| Turnout | 7,255 | 55% | |||
Croxteth
| Party | Candidate | Votes | % | ±% | |
|---|---|---|---|---|---|
| Conservative | Sydney Smart | 6,478 | 51% | ||
| Labour | William Henry Barton | 5,874 | 47% | ||
| Communist | Miss Winifred May George | 244 | 2% | ||
| Majority | 604 | ||||
| Registered electors | 32,352 | ||||
| Turnout | 12,596 | 39% | |||
| Conservative hold | Swing | ||||
Dingle
| Party | Candidate | Votes | % | ±% | |
|---|---|---|---|---|---|
| Conservative | Edward Thomas White | 4,951 | 54% | ||
| Labour | Edward Daniel Whittle | 4,194 | 46% | ||
| Majority | 757 | ||||
| Registered electors | 18,941 | ||||
| Turnout | 9,145 | 48% | |||
| Conservative hold | Swing | ||||
Edge Hill
| Party | Candidate | Votes | % | ±% | |
|---|---|---|---|---|---|
| Labour | John Bagot | 2,822 | 54% | ||
| Conservative | Stanley Alexander Hughes | 2,411 | 46% | ||
| Independent | Charles Henry Parry | 39 | 1% | ||
| Majority | 411 | ||||
| Registered electors | 13,606 | ||||
| Turnout | 5,272 | 39% | |||
| Labour hold | Swing | ||||
Everton
| Party | Candidate | Votes | % | ±% | |
|---|---|---|---|---|---|
| Labour | John Braddock | 3,138 | 58% | ||
| Conservative | Charles C. Carter | 2,246 | 42% | ||
| Majority | 892 | ||||
| Registered electors | 13,792 | ||||
| Turnout | 5,384 | 39% | |||
| Labour hold | Swing | ||||
Exchange
| Party | Candidate | Votes | % | ±% | |
|---|---|---|---|---|---|
| Independent | Walter McGrath | 704 | 79% | ||
| Labour | Francis Edward Campbell | 188 | 21% | ||
| Majority | 516 | ||||
| Registered electors | 1,620 | ||||
| Turnout | 892 | 55% | |||
| Independent hold | Swing | ||||
Fairfield
| Party | Candidate | Votes | % | ±% | |
|---|---|---|---|---|---|
| Conservative | Robert Nash | 5,368 | 66% | ||
| Labour | Isidore Levin | 2,818 | 34% | ||
| Majority | 2,550 | ||||
| Registered electors | 15,930 | ||||
| Turnout | 8,186 | 51% | |||
| Conservative hold | Swing | ||||
Fazakerley
| Party | Candidate | Votes | % | ±% | |
|---|---|---|---|---|---|
| Conservative | Kenneth Pugh Thompson | 5,571 | 54% | ||
| Labour | John F. Hughes | 4,779 | 46% | ||
| Majority | 792 | ||||
| Registered electors | 20,381 | ||||
| Turnout | 10,350 | 51% | |||
| Conservative hold | Swing | ||||
Garston
| Party | Candidate | Votes | % | ±% | |
|---|---|---|---|---|---|
| Conservative | Henry Clarke | 5,106 | 54% | ||
| Labour | William H. Sefton | 4,306 | 46% | ||
| Majority | 800 | ||||
| Registered electors | 16,631 | ||||
| Turnout | 9,412 | 57% | |||
| Conservative hold | Swing | ||||
Granby
| Party | Candidate | Votes | % | ±% | |
|---|---|---|---|---|---|
| Conservative | James Edward Thompson | 3,123 | 55% | ||
| Labour | Victor Harold E. Baker | 2,605 | 45% | ||
| Majority | 518 | ||||
| Registered electors | 13,351 | ||||
| Turnout | 5,728 | 43% | |||
| Conservative hold | Swing | ||||
Great George
| Party | Candidate | Votes | % | ±% | |
|---|---|---|---|---|---|
| Conservative | John Gwilym Hughes | 1,016 | 55% | ||
| Labour | Clifford Selly | 815 | 45% | ||
| Majority | 201 | ||||
| Registered electors | 3,894 | ||||
| Turnout | 1,831 | 47% | |||
| Conservative hold | Swing | ||||
Kensington
| Party | Candidate | Votes | % | ±% | |
|---|---|---|---|---|---|
| Conservative | Harold W. Hughes | 4,033 | 56% | ||
| Labour | Joseph Brogan | 3,221 | 44% | ||
| Majority | 812 | ||||
| Registered electors | 14,481 | ||||
| Turnout | 7,254 | 50% | |||
| Conservative hold | Swing | ||||
Kirkdale
| Party | Candidate | Votes | % | ±% | |
|---|---|---|---|---|---|
| Labour | John Francis Carr | 4,680 | 52% | ||
| Conservative | Joseph Trevor Booth | 4,328 | 48% | ||
| Majority | 352 | ||||
| Registered electors | 19,759 | ||||
| Turnout | 9,008 | 46% | |||
| Labour hold | Swing | ||||
Little Woolton
| Party | Candidate | Votes | % | ±% | |
|---|---|---|---|---|---|
| Conservative | Gordon Frederick Catlin | 1,134 | 84% | ||
| Labour | William Thomas Benn | 189 | 14% | ||
| Independent | Frederick Bowman | 21 | 2% | ||
| Majority | 945 | ||||
| Registered electors | 1,974 | ||||
| Turnout | 1,344 | 68% | |||
| Conservative hold | Swing | ||||
Low Hill
| Party | Candidate | Votes | % | ±% | |
|---|---|---|---|---|---|
| Conservative | Samuel Cecil Saltmarsh | 3,319 | 55% | ||
| Labour | David Horan | 2,716 | 45% | ||
| Majority | 603 | ||||
| Registered electors | 12,346 | ||||
| Turnout | 6,035 | 49% | |||
| Conservative hold | Swing | ||||
Much Woolton
| Party | Candidate | Votes | % | ±% | |
|---|---|---|---|---|---|
| Conservative | Isaac Robinson | 2,331 | 74% | ||
| Labour | Noel Arthur Pinches | 838 | 26% | ||
| Majority | 1,493 | ||||
| Registered electors | 5,463 | ||||
| Turnout | 3,169 | 58% | |||
| Conservative hold | Swing | ||||
Netherfield
| Party | Candidate | Votes | % | ±% | |
|---|---|---|---|---|---|
| Protestant | George Edward Lewis | 2,446 | 63% | ||
| Labour | George Carmichael | 1,427 | 37% | ||
| Majority | 1,019 | ||||
| Registered electors | 10,375 | ||||
| Turnout | 3,873 | 37% | |||
| Protestant hold | Swing | ||||
North Scotland
| Party | Candidate | Votes | % | ±% | |
|---|---|---|---|---|---|
| Labour | Frederick William Tucker | 1,781 | 75% | ||
| Conservative | John Kenneth Hart | 416 | 18% | ||
| Communist | John Coward | 172 | 7% | ||
| Majority | 1,365 | ||||
| Registered electors | 7,237 | ||||
| Turnout | 2,369 | 33% | |||
| Labour hold | Swing | ||||
Old Swan
| Party | Candidate | Votes | % | ±% | |
|---|---|---|---|---|---|
| Conservative | Alfred Nathaniel Bates | 9,000 | 66% | ||
| Labour | William Williams | 4,669 | 34% | ||
| Majority | 4,331 | ||||
| Registered electors | 28,181 | ||||
| Turnout | 13,669 | 49% | |||
| Conservative hold | Swing | ||||
Prince's Park
| Party | Candidate | Votes | % | ±% | |
|---|---|---|---|---|---|
| Conservative | Charles Cowlin | 3,456 | 55% | ||
| Labour | Henry Evans | 2,838 | 45% | ||
| Majority | 618 | ||||
| Registered electors | 12,488 | ||||
| Turnout | 6,294 | 50% | |||
| Conservative hold | Swing | ||||
Sandhills
| Party | Candidate | Votes | % | ±% | |
|---|---|---|---|---|---|
| Labour | Stanley Part | 2,421 | 73% | ||
| Conservative | Frederick Charles Hitches | 891 | 27% | ||
| Majority | 1,530 | ||||
| Registered electors | 8,047 | ||||
| Turnout | 3,312 | 41% | |||
| Labour hold | Swing | ||||
St. Anne's
| Party | Candidate | Votes | % | ±% | |
|---|---|---|---|---|---|
| Labour | Abram Louis Caplan | 1,679 | 62% | ||
| Conservative | Joseph Edward Gallagher | 574 | 21% | ||
| Independent | Thomas Patrick Healy | 452 | 17% | ||
| Majority | 1,105 | ||||
| Registered electors | 6,242 | ||||
| Turnout | 2,705 | 43% | |||
| Labour hold | Swing | ||||
St. Domingo
| Party | Candidate | Votes | % | ±% | |
|---|---|---|---|---|---|
| Protestant | Mrs. Mary Jane Longbottom | 3,336 | 60% | ||
| Labour | Walter Richard Maylor | 2,222 | 40% | ||
| Majority | 1,114 | ||||
| Registered electors | 13,378 | ||||
| Turnout | 5,558 | 42% | |||
| Protestant hold | Swing | ||||
St. Peter's
| Party | Candidate | Votes | % | ±% | |
|---|---|---|---|---|---|
| Conservative | James William Brown | 411 | 70% | ||
| Labour | Peter James O'Hare | 178 | 30% | ||
| Majority | 233 | ||||
| Registered electors | 1,281 | ||||
| Turnout | 589 | 46% | |||
| Conservative hold | Swing | ||||
Sefton Park East
| Party | Candidate | Votes | % | ±% | |
|---|---|---|---|---|---|
| Conservative | Walter Isaac Throssell | 4,555 | 74% | ||
| Labour | Norman Bates | 1,622 | 26% | ||
| Majority | 2,933 | ||||
| Registered electors | 14,687 | ||||
| Turnout | 6,177 | 42% | |||
| Conservative hold | Swing | ||||
Sefton Park West
| Party | Candidate | Votes | % | ±% | |
|---|---|---|---|---|---|
| Conservative | Frederick Bidston | 4,454 | 78% | ||
| Labour | Mrs. Anne Caine | 1,292 | 22% | ||
| Majority | 3,162 | ||||
| Registered electors | 11,243 | ||||
| Turnout | 5,746 | 51% | |||
| Conservative hold | Swing | ||||
South Scotland
| Party | Candidate | Votes | % | ±% | |
|---|---|---|---|---|---|
| Labour | John Sheehan | unopposed | |||
| Registered electors | 6,302 | ||||
| Labour hold | Swing | ||||
Vauxhall
| Party | Candidate | Votes | % | ±% | |
|---|---|---|---|---|---|
| Labour | Joseph Cyril Brady | 918 | 69% | ||
| Conservative | Mrs. Freda James | 421 | 31% | ||
| Majority | 497 | ||||
| Registered electors | 2,705 | ||||
| Turnout | 1,339 | 50% | |||
| Labour hold | Swing | ||||
Walton
| Party | Candidate | Votes | % | ±% | |
|---|---|---|---|---|---|
| Conservative | Mrs. Mary Elizabeth Jones | 7,331 | 60% | ||
| Labour | William Richard Gerrard | 4,921 | 40% | ||
| Majority | 2,410 | ||||
| Registered electors | 23,678 | ||||
| Turnout | 12,252 | 52% | |||
| Conservative hold | Swing | ||||
Warbreck
| Party | Candidate | Votes | % | ±% | |
|---|---|---|---|---|---|
| Conservative | William Rickard | 6,661 | 71% | ||
| Labour | Francis David Heron | 2,690 | 29% | ||
| Majority | 3,971 | ||||
| Registered electors | 19,774 | ||||
| Turnout | 9,351 | 47% | |||
| Conservative hold | Swing | ||||
Wavertree
| Party | Candidate | Votes | % | ±% | |
|---|---|---|---|---|---|
| Conservative | Stanley Ronald Williams | 8,590 | 73% | ||
| Labour | Francis Burke | 3,225 | 27% | ||
| Majority | 5,365 | ||||
| Registered electors | 23,200 | ||||
| Turnout | 11,815 | 51% | |||
| Conservative hold | Swing | ||||
Wavertree West
| Party | Candidate | Votes | % | ±% | |
|---|---|---|---|---|---|
| Conservative | Harold Lees | 3,487 | 55% | ||
| Labour | Thomas Warburton Jolley | 2,857 | 45% | ||
| Majority | 630 | ||||
| Registered electors | 11,729 | ||||
| Turnout | 6,344 | 54% | |||
| Conservative hold | Swing | ||||
West Derby
| Party | Candidate | Votes | % | ±% | |
|---|---|---|---|---|---|
| Conservative | Hedley Arthur Williams | 11,202 | 69% | ||
| Labour | Edward William Harby | 5,008 | 31% | ||
| Majority | 6,194 | ||||
| Registered electors | 31,782 | ||||
| Turnout | 16,210 | 51% | |||
| Conservative hold | Swing | ||||
By-elections
Great George 20 January 1948
Caused by the resignation of Mr. Robert Edward Cottier (Labour, elected November 1945).
| Party | Candidate | Votes | % | ±% | |
|---|---|---|---|---|---|
| Labour | Clifford Skelly | 719 | 50% | ||
| Conservative | Charlotte Emma Turner | 716 | 50% | ||
| Majority | 3 | ||||
| Registered electors | 3,894 | ||||
| Turnout | 1,435 | ||||
| Conservative gain from Labour | Swing | ||||
Kensington 15 April 1948
Caused by the death of Councillor Frederick Harold Bailey (Conservative, elected November 1946) on 24 February 1948 [5]
| Party | Candidate | Votes | % | ±% | |
|---|---|---|---|---|---|
| Conservative | Stephen Minion | 3,199 | |||
| Labour | Joseph Brogan | 2,267 | |||
| Majority | |||||
| Registered electors | 14,481 | ||||
| Turnout | 5,466 | ||||
| Conservative hold | Swing | ||||
Walton 10 June 1948
Alderman James Graham Reece JP died on 24 March 1948' [7]
Councillor Reginald Richard Bailey was elected as an Alderman by the Council on 5 May 1948. [8]
| Party | Candidate | Votes | % | ±% | |
|---|---|---|---|---|---|
| Conservative | George Moore | 5,145 | |||
| Labour | William Richard Gerrard | 3,056 | |||
| Majority | 2,109 | ||||
| Registered electors | 23,678 | ||||
| Turnout | 8,205 | ||||
| Conservative hold | Swing | ||||
Edge Hill 22 July 1948
Caused by the resignation of Arthur Leadbetter (Labour, elected November 1946)
| Party | Candidate | Votes | % | ±% | |
|---|---|---|---|---|---|
| Labour | David Horan | 2,217 | |||
| Samuel Curtis | 1,876 | ||||
| Sidney Foster | 85 | ||||
| Independent | Charles Henry Parry | 18 | |||
| Majority | 341 | ||||
| Registered electors | 13,606 | ||||
| Turnout | |||||
| Labour hold | Swing | ||||
Councillor James Bennett O.B.E. died on 24 September 1948. [11]
Councillor James Forster Brakell died on 4 October 1948. [12]
References
- ↑ Jeffery, David. "Merseyside Local Election Results Project". Dr David Jeffery. Retrieved 14 April 2021.
- ↑ Liverpool Daily Post 2 November 1947
- ↑ Liverpool City Council Proceedings of the Council 1947-1948
- ↑ Liverpool City Council Proceedings of the Council 1947-1948 page 229
- ↑ Liverpool City Council Proceedings of the Council 1947-1948 page 290
- ↑ Liverpool City Council Proceedings of the Council 1947-1948 page 430
- ↑ Liverpool City Council Proceedings of the Council 1947-1948 page 364
- ↑ Liverpool City Council Proceedings of the Council 1947-1948 page 431
- ↑ Liverpool City Council Proceedings of the Council 1947-1948 page 588
- ↑ Liverpool City Council Proceedings of the Council 1947-1948 page 668
- ↑ Liverpool City Council Proceedings of the Council 1947-1948 page 746
- ↑ Liverpool City Council Proceedings of the Council 1947-1948 page 746
(1946 ←) | |
|---|---|
|