| |||||||||||||||||||||||||||||||||||||||||||||||||
22 of 66 seats (One Third) to Wirral Metropolitan Borough Council 34 seats needed for a majority | |||||||||||||||||||||||||||||||||||||||||||||||||
|---|---|---|---|---|---|---|---|---|---|---|---|---|---|---|---|---|---|---|---|---|---|---|---|---|---|---|---|---|---|---|---|---|---|---|---|---|---|---|---|---|---|---|---|---|---|---|---|---|---|
| Turnout | 38.2% ( | ||||||||||||||||||||||||||||||||||||||||||||||||
| |||||||||||||||||||||||||||||||||||||||||||||||||
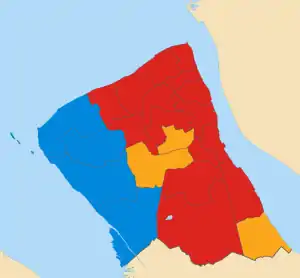 Map of results of 1995 election | |||||||||||||||||||||||||||||||||||||||||||||||||
| |||||||||||||||||||||||||||||||||||||||||||||||||
The 1995 Wirral Metropolitan Borough Council election took place on 4 May 1995 to elect members of Wirral Metropolitan Borough Council in England.[2] This election was held on the same day as other local elections.
After the election, the composition of the council was:
| Party | Seats | ± | |
|---|---|---|---|
| Labour | 36 | ||
| Conservative | 22 | ||
| Liberal Democrats | 8 | ||
Election results
Overall election result
Overall result compared with 1994.
| Wirral Metropolitan Borough Council election results, 1995 | |||||||||||||||
|---|---|---|---|---|---|---|---|---|---|---|---|---|---|---|---|
| Party | Candidates | Votes | |||||||||||||
| Stood | Elected | Gained | Unseated | Net | % of total | % | No. | Net % | |||||||
| Labour | 22 | 15 | 6 | 0 | 68.2 | 53.5 | 51,052 | ||||||||
| Conservative | 21 | 4 | 0 | 6 | 18.2 | 25.8 | 24,550 | ||||||||
| Liberal Democrats | 22 | 3 | 1 | 1 | 13.6 | 20.1 | 19,179 | ||||||||
| Green | 6 | 0 | 0 | 0 | 0.0 | 0.6 | 558 | ||||||||
Ward results
Bebington
| Party | Candidate | Votes | % | ±% | |
|---|---|---|---|---|---|
| Labour | Patrick Smith | 2,685 | 52.6 | ||
| Conservative | Hilary Jones | 2,045 | 40.1 | ||
| Liberal Democrats | Kevin Turner | 375 | 7.3 | ||
| Majority | 640 | 12.5 | |||
| Registered electors | 10,735 | ||||
| Turnout | 47.6 | ||||
| Labour gain from Conservative | Swing | ||||
Bidston
| Party | Candidate | Votes | % | ±% | |
|---|---|---|---|---|---|
| Labour | Harry Smith | 2,401 | 90.6 | ||
| Liberal Democrats | John Tomlinson | 128 | 4.8 | ||
| Conservative | P. Weare | 121 | 4.6 | ||
| Majority | 2,273 | 85.8 | |||
| Registered electors | 8,446 | ||||
| Turnout | 31.4 | ||||
| Labour hold | Swing | ||||
Birkenhead
| Party | Candidate | Votes | % | ±% | |
|---|---|---|---|---|---|
| Labour | Phillip Davies | 2,850 | 88.3 | ||
| Liberal Democrats | P. Cooke | 196 | 6.1 | ||
| Conservative | B. Brassey | 183 | 5.7 | ||
| Majority | 2,654 | 82.2 | |||
| Registered electors | 10,508 | ||||
| Turnout | 30.7 | ||||
| Labour hold | Swing | ||||
Bromborough
| Party | Candidate | Votes | % | ±% | |
|---|---|---|---|---|---|
| Labour | R. Mullins | 2,950 | 73.2 | ||
| Conservative | K. Roberts | 653 | 16.2 | ||
| Liberal Democrats | M. Bolton | 427 | 10.6 | ||
| Majority | 2,297 | 57.0 | |||
| Registered electors | 11,102 | ||||
| Turnout | 36.3 | ||||
| Labour hold | Swing | ||||
Clatterbridge
| Party | Candidate | Votes | % | ±% | |
|---|---|---|---|---|---|
| Labour | Audrey Moore | 2,486 | 42.8 | ||
| Conservative | Leonard Moore | 2,201 | 37.9 | ||
| Liberal Democrats | W. Walsh | 1,119 | 19.3 | ||
| Majority | 285 | 4.9 | N/A | ||
| Registered electors | 13,974 | ||||
| Turnout | 41.5 | ||||
| Labour gain from Conservative | Swing | ||||
Claughton
| Party | Candidate | Votes | % | ±% | |
|---|---|---|---|---|---|
| Labour | Andrew Day | 2,205 | 49.8 | ||
| Liberal Democrats | Stuart Kelly | 1,644 | 37.1 | ||
| Conservative | P. Greening-Jackson | 509 | 11.5 | ||
| Green | K. Cuthbertson | 73 | 1.6 | New | |
| Majority | 561 | 12.7 | |||
| Registered electors | 10,607 | ||||
| Turnout | 41.8 | ||||
| Labour gain from Liberal Democrats | Swing | ||||
Eastham
| Party | Candidate | Votes | % | ±% | |
|---|---|---|---|---|---|
| Liberal Democrats | George Mitchell | 2,782 | 58.8 | ||
| Labour | A. Sheppard | 1,407 | 29.8 | ||
| Conservative | D. Jones | 539 | 11.4 | ||
| Majority | 1,375 | 29.1 | |||
| Registered electors | 11,345 | ||||
| Turnout | 41.7 | ||||
| Liberal Democrats hold | Swing | ||||
Egerton
| Party | Candidate | Votes | % | ±% | |
|---|---|---|---|---|---|
| Labour | Walter Smith | 2,884 | 76.8 | ||
| Conservative | M. Vickers | 461 | 12.3 | ||
| Liberal Democrats | D. Roberts | 327 | 8.7 | ||
| Green | Joyce Hogg | 82 | 2.2 | New | |
| Majority | 2,423 | 64.5 | |||
| Registered electors | 10,832 | ||||
| Turnout | 34.7 | ||||
| Labour hold | Swing | ||||
Heswall
| Party | Candidate | Votes | % | ±% | |
|---|---|---|---|---|---|
| Conservative | Peter Johnson | 2,874 | 56.0 | ||
| Labour | L. Flanagan | 1,244 | 24.3 | ||
| Liberal Democrats | Edward Norton | 1,011 | 19.7 | ||
| Majority | 1,630 | 31.8 | |||
| Registered electors | 13,295 | ||||
| Turnout | 38.6 | ||||
| Conservative hold | Swing | ||||
Hoylake
| Party | Candidate | Votes | % | ±% | |
|---|---|---|---|---|---|
| Conservative | John Hale | 2,544 | 53.4 | ||
| Labour | Pauline Cocker | 1,490 | 31.3 | ||
| Liberal Democrats | A. Richards | 731 | 15.3 | ||
| Majority | 1,054 | 22.1 | |||
| Registered electors | 12,544 | ||||
| Turnout | 38.0 | ||||
| Conservative hold | Swing | ||||
Leasowe
| Party | Candidate | Votes | % | ±% | |
|---|---|---|---|---|---|
| Labour | Ernest Prout | 2,641 | 81.9 | ||
| Conservative | H. Tooke | 326 | 10.1 | ||
| Liberal Democrats | Susanne Uriel | 259 | 8.0 | ||
| Majority | 2,315 | 71.8 | |||
| Registered electors | 9,581 | ||||
| Turnout | 33.7 | ||||
| Labour hold | Swing | ||||
Liscard
| Party | Candidate | Votes | % | ±% | |
|---|---|---|---|---|---|
| Labour | John Cocker | 2,985 | 71.9 | ||
| Liberal Democrats | M. Todd | 1,169 | 28.1 | ||
| Majority | 1,816 | 43.7 | |||
| Registered electors | 11,324 | ||||
| Turnout | 36.7 | ||||
| Labour hold | Swing | ||||
Moreton
| Party | Candidate | Votes | % | ±% | |
|---|---|---|---|---|---|
| Labour | Margaret Green | 2,534 | 58.4 | ||
| Conservative | Ann Dishman | 1,506 | 34.7 | ||
| Liberal Democrats | C. Robertson | 300 | 6.9 | ||
| Majority | 1,028 | 23.7 | |||
| Registered electors | 9,662 | ||||
| Turnout | 44.9 | ||||
| Labour gain from Conservative | Swing | ||||
New Brighton
| Party | Candidate | Votes | % | ±% | |
|---|---|---|---|---|---|
| Labour | Mike Keenan | 2,608 | 62.4 | ||
| Conservative | Vera Ruck | 1,042 | 24.9 | ||
| Liberal Democrats | John Codling | 531 | 12.7 | ||
| Majority | 1,566 | 35.7 | |||
| Registered electors | 11,563 | ||||
| Turnout | 36.2 | ||||
| Labour gain from Conservative | Swing | ||||
Oxton
| Party | Candidate | Votes | % | ±% | |
|---|---|---|---|---|---|
| Liberal Democrats | Patricia Williams | 2,473 | 53.3 | ||
| Labour | Denis Knowles | 1,428 | 30.8 | ||
| Conservative | Cyrus Ferguson | 655 | 14.1 | ||
| Green | Garnette Bowler | 80 | 1.7 | New | |
| Majority | 1,045 | 22.5 | |||
| Registered electors | 11,613 | ||||
| Turnout | 39.9 | ||||
| Liberal Democrats hold | Swing | ||||
Prenton
| Party | Candidate | Votes | % | ±% | |
|---|---|---|---|---|---|
| Liberal Democrats | Edward Cunniffe | 2,360 | 46.2 | ||
| Labour | Keith Williams | 1,828 | 35.8 | ||
| Conservative | A. Adams [n 1] | 919 | 18.0 | ||
| Majority | 532 | 10.4 | |||
| Registered electors | 11,752 | ||||
| Turnout | 43.5 | ||||
| Liberal Democrats gain from Conservative | Swing | ||||
Royden
| Party | Candidate | Votes | % | ±% | |
|---|---|---|---|---|---|
| Conservative | C. Kevan | 2,161 | 45.4 | ||
| Labour | R. Pennington | 1,534 | 32.3 | ||
| Liberal Democrats | Peter Reisdorf | 952 | 20.0 | ||
| Green | Cecil Bowler | 108 | 2.3 | New | |
| Majority | 627 | 13.2 | |||
| Registered electors | 12,638 | ||||
| Turnout | 37.6 | ||||
| Conservative hold | Swing | ||||
Seacombe
| Party | Candidate | Votes | % | ±% | |
|---|---|---|---|---|---|
| Labour | Adrian Jones | 3,200 | 83.5 | ||
| Conservative | Patricia Jones | 315 | 8.2 | ||
| Liberal Democrats | M. Wright | 219 | 5.7 | ||
| Green | M. Godwin | 99 | 2.6 | New | |
| Majority | 2,885 | 75.3 | |||
| Registered electors | 11,321 | ||||
| Turnout | 33.9 | ||||
| Labour hold | Swing | ||||
Thurstaston
| Party | Candidate | Votes | % | ±% | |
|---|---|---|---|---|---|
| Conservative | Jeffrey Green | 2,084 | 46.2 | ||
| Labour | A. Bell | 1,789 | 39.6 | ||
| Liberal Democrats | Charles Wall | 641 | 14.2 | New | |
| Majority | 295 | 6.5 | |||
| Registered electors | 12,510 | ||||
| Turnout | 36.1 | ||||
| Conservative hold | Swing | ||||
Tranmere
| Party | Candidate | Votes | % | ±% | |
|---|---|---|---|---|---|
| Labour | Christine Meaden | 2,478 | 83.7 | ||
| Conservative | H. Jackson-Payne | 185 | 6.3 | ||
| Liberal Democrats | Stephen Blaylock | 181 | 6.1 | ||
| Green | Nigel Birchenough | 116 | 3.9 | ||
| Majority | 2,293 | 77.5 | |||
| Registered electors | 9,762 | ||||
| Turnout | 30.3 | ||||
| Labour hold | Swing | ||||
Upton
| Party | Candidate | Votes | % | ±% | |
|---|---|---|---|---|---|
| Labour | Peter Corcoran | 3,109 | 64.6 | ||
| Conservative | D. Smith | 1,157 | 24.1 | ||
| Liberal Democrats | E. Davies | 543 | 11.3 | ||
| Majority | 1,952 | 40.6 | |||
| Registered electors | 12,810 | ||||
| Turnout | 37.5 | ||||
| Labour hold | Swing | ||||
Wallasey
| Party | Candidate | Votes | % | ±% | |
|---|---|---|---|---|---|
| Labour | Melanie Iredale | 2,316 | 44.6 | ||
| Conservative | Lesley Rennie [n 2] | 2,070 | 39.8 | ||
| Liberal Democrats | John Uriel | 811 | 15.6 | ||
| Majority | 246 | 4.7 | N/A | ||
| Registered electors | 11,943 | ||||
| Turnout | 43.5 | ||||
| Labour gain from Conservative | Swing | ||||
Notes
• italics denote the sitting councillor • bold denotes the winning candidate
- ↑ Incumbent councillor for New Brighton ward.
- ↑ Incumbent councillor for Prenton ward.
References
- 1 2 "Local Election Summaries 1995". The Elections Centre. Retrieved 17 January 2019.
- 1 2 3 4 5 6 7 8 9 10 11 12 13 14 15 16 17 18 19 20 21 22 23 24 "Metropolitan Borough of Wirral Election Results 1973-2012 (Pg. 13)" (PDF). The Elections Centre. Retrieved 17 January 2019.
- ↑ "Council compositions". The Elections Centre. Retrieved 27 July 2018.
- ↑ "Councillor Tony Smith". Wirral Metropolitan Borough Council.
- ↑ "Councillor Harry Smith". Wirral Metropolitan Borough Council.
- ↑ "Councillor Phil Davies". Wirral Metropolitan Borough Council. Archived from the original on 12 June 2018. Retrieved 20 January 2019.
- ↑ "Councillor Stuart Kelly". Wirral Metropolitan Borough Council. 7 August 2023.
- ↑ "Councillor Dave Mitchell". Wirral Metropolitan Borough Council.
- ↑ "Councillor Walter Smith". Wirral Metropolitan Borough Council. Archived from the original on 12 June 2018. Retrieved 20 January 2019.
- ↑ "Councillor Peter Johnson". Wirral Metropolitan Borough Council.
- ↑ "Councillor John Hale". Wirral Metropolitan Borough Council. Archived from the original on 5 July 2018. Retrieved 20 January 2019.
- ↑ "Councillor Pat Williams". Wirral Metropolitan Borough Council. Archived from the original on 12 June 2018. Retrieved 20 January 2019.
- ↑ "Councillor Denis Knowles". Wirral Metropolitan Borough Council.
- ↑ "Councillor Jerry Williams". Wirral Metropolitan Borough Council. 7 August 2023.
- ↑ "Councillor Peter Reisdorf". Wirral Metropolitan Borough Council.
- ↑ "Councillor Adrian Jones". Wirral Metropolitan Borough Council.
- ↑ "Councillor Jeff Green". Wirral Metropolitan Borough Council. 7 August 2023.
- ↑ "Councillor Chris Meaden". Wirral Metropolitan Borough Council.
- ↑ "Councillor Lesley Rennie". Wirral Metropolitan Borough Council. 7 August 2023.
Mellows-Facer, Adam (10 May 2006). "Local election 2006". parliament.uk. Retrieved 29 December 2018.
"BBC NEWS VOTE 2003 WIRRAL". BBC News. 1 May 2003. Retrieved 29 December 2018.
| Metropolitan boroughs |
|
|---|---|
| Unitary authorities |
|
| District councils |
|
| Welsh councils |
|
| Scottish councils |
|
This article is issued from Wikipedia. The text is licensed under Creative Commons - Attribution - Sharealike. Additional terms may apply for the media files.