| ||||||||||||||||||||||||||||||||||||||||
22 of 66 seats on Sefton Metropolitan Borough Council 34 seats needed for a majority | ||||||||||||||||||||||||||||||||||||||||
|---|---|---|---|---|---|---|---|---|---|---|---|---|---|---|---|---|---|---|---|---|---|---|---|---|---|---|---|---|---|---|---|---|---|---|---|---|---|---|---|---|
| ||||||||||||||||||||||||||||||||||||||||
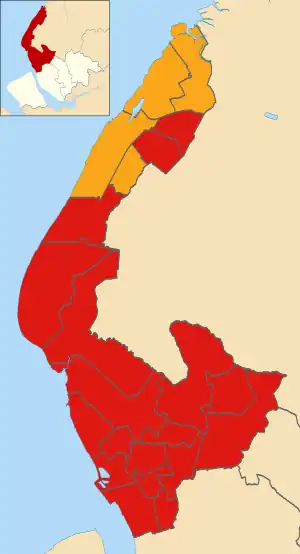 Winner of each seat at the 2023 Sefton Metropolitan Borough Council election | ||||||||||||||||||||||||||||||||||||||||
| ||||||||||||||||||||||||||||||||||||||||
The 2023 Sefton Metropolitan Borough Council election were held on 4 May 2023 to elect members of Sefton Metropolitan Borough Council in England.[1]
Labour retained and increased its majority on the council.[2][3]
Summary
Overview
The Labour Group gained 5 seats at the elections held on 4 May 2023 and the Liberal Democrat Group subsequently gained 1 seat as a result of Councillor Sinclair D'Albuquerque (Independent) joining them on 13 May 2003.
Election result
| 2023 Sefton Metropolitan Borough Council election | ||||||||||
|---|---|---|---|---|---|---|---|---|---|---|
| Party | This election | Full council | This election | |||||||
| Seats | Net | Seats % | Other | Total | Total % | Votes | Votes % | +/− | ||
| Labour | 18 | 33,974 | 52.9 | +3.6 | ||||||
| Liberal Democrats | 4 | 10,515 | 16.4 | +1.2 | ||||||
| Conservative | 0 | 10,437 | 16.3 | –3.9 | ||||||
| Green | 0 | 4,387 | 6.8 | +2.1 | ||||||
| FRAG | 0 | 994 | 1.5 | ±0.0 | ||||||
| Maghull Community Independents | 0 | 1,608 | 2.5 | N/A | ||||||
| Independent | 0 | 1,472 | 2.3 | –6.4 | ||||||
| Freedom Alliance | 0 | 461 | 0.7 | N/A | ||||||
| TUSC | 0 | 248 | 0.4 | N/A | ||||||
| Reform UK | 0 | 110 | 0.2 | N/A | ||||||
Results by Ward
Candidates seeking re-election are marked with an asterisk (*)
Ainsdale
| Party | Candidate | Votes | % | ±% | |
|---|---|---|---|---|---|
| Labour | Janet Harrison | 1,497 | 35.5 | ||
| Liberal Democrats | Lesley Delves | 1,481 | 35.2 | ||
| Conservative | Nigel Ball | 1,046 | 24.8 | ||
| Green | Laurence Rankin | 187 | 4.4 | ||
| Majority | 16 | 0.3 | |||
| Registered electors | 9,973 | ||||
| Turnout | 4,211 | 42 | |||
| Rejected ballots | 12 | ||||
| Labour gain from Conservative | Swing | ||||
Birkdale
| Party | Candidate | Votes | % | ±% | |
|---|---|---|---|---|---|
| Liberal Democrats | Simon Shaw* | 1,431 | 40.5 | ||
| Labour | Ged Wright | 1,356 | 38.3 | ||
| Conservative | Sam Harris | 504 | 14.3 | ||
| Green | David Collins | 134 | 3.7 | ||
| Reform UK | Andrew Lynn | 110 | 3.1 | New | |
| Majority | 75 | 2.1 | |||
| Registered electors | 9,992 | ||||
| Turnout | 3,535 | 35 | |||
| Rejected ballots | 6 | ||||
| Liberal Democrats hold | Swing | ||||
Blundellsands
| Party | Candidate | Votes | % | ±% | |
|---|---|---|---|---|---|
| Labour | Christine Howard* | 2,390 | 67 | ||
| Conservative | Katie Burgess | 663 | 19 | ||
| Liberal Democrats | Brian Dunning | 266 | 7 | ||
| Green | Kieran Dams | 254 | 7 | ||
| Majority | 1,727 | ||||
| Registered electors | 9,187 | ||||
| Turnout | 3,573 | 39 | |||
| Rejected ballots | 22 | ||||
| Labour hold | Swing | ||||
Cambridge
| Party | Candidate | Votes | % | ±% | |
|---|---|---|---|---|---|
| Liberal Democrats | Leo Evans* | 1,468 | 43 | ||
| Conservative | Gary Haran Doyle | 1,175 | 34 | ||
| Labour | Joanne Faulkner | 658 | 19 | ||
| Green | Carla Fox | 140 | 4 | ||
| Majority | 293 | ||||
| Registered electors | 9,701 | ||||
| Turnout | 3,441 | 35 | |||
| Rejected ballots | 28 | ||||
| Liberal Democrats hold | Swing | ||||
Church
| Party | Candidate | Votes | % | ±% | |
|---|---|---|---|---|---|
| Labour | Veronica Webster* | 1,459 | 54 | ||
| Green | Neil Doolin | 1,090 | 40 | ||
| Conservative | Graham Campbell | 115 | 4 | ||
| Freedom Alliance | John Bellis | 59 | 2 | ||
| Majority | 369 | ||||
| Registered electors | 9,078 | ||||
| Turnout | 2,723 | 30 | |||
| Rejected ballots | 11 | ||||
| Labour hold | Swing | ||||
Derby
| Party | Candidate | Votes | % | ±% | |
|---|---|---|---|---|---|
| Labour | Dave Robinson* | 1,652 | 80.9 | -4.1 | |
| Green | Kate Robinson | 149 | 7.3 | New | |
| Conservative | Paul Barber | 139 | 6.8 | -0.8 | |
| TUSC | Dean Young | 103 | 5.0 | New | |
| Majority | 1,503 | ||||
| Registered electors | 8,984 | ||||
| Turnout | 2,043 | 23 | |||
| Rejected ballots | 16 | ||||
| Labour hold | Swing | ||||
Dukes
| Party | Candidate | Votes | % | ±% | |
|---|---|---|---|---|---|
| Liberal Democrats | John Pugh* | 1,496 | 42 | ||
| Conservative | Laura Nuttall | 1,214 | 34 | ||
| Labour | Trevor Vaughan | 676 | 19 | ||
| Green | Alwynne Cartmell | 165 | 5 | ||
| Majority | 282 | ||||
| Registered electors | 10,419 | ||||
| Turnout | 3,551 | 34 | |||
| Rejected ballots | 9 | ||||
| Liberal Democrats hold | Swing | ||||
Ford
| Party | Candidate | Votes | % | ±% | |
|---|---|---|---|---|---|
| Labour | Ian Moncur* | 1,638 | 81 | ||
| Green | Lyndsey Davies | 205 | 10 | ||
| Conservative | Harry Bliss | 127 | 6 | ||
| Liberal Democrats | Adarsh Makdani | 55 | 3 | ||
| Majority | 1,433 | ||||
| Registered electors | 9,244 | ||||
| Turnout | 2,025 | 22 | |||
| Rejected ballots | 8 | ||||
| Labour hold | Swing | ||||
Harington
| Party | Candidate | Votes | % | ±% | |
|---|---|---|---|---|---|
| Labour | Peter Harvey | 1,485 | 38 | ||
| Formby Residents Action Group | Dave Irving* | 994 | 26 | ||
| Conservative | Michael Shaw | 953 | 25 | ||
| Liberal Democrats | Annie Gorski | 263 | 7 | ||
| Green | Michael Walsh | 181 | 5 | ||
| Majority | 491 | ||||
| Registered electors | 9,693 | ||||
| Turnout | 3,876 | 40 | |||
| Rejected ballots | 12 | ||||
| Labour gain from Formby Residents Action Group | Swing | ||||
Kew
| Party | Candidate | Votes | % | ±% | |
|---|---|---|---|---|---|
| Labour | Sean Halsall* | 1,599 | 53 | ||
| Liberal Democrats | Vic Foulds | 622 | 20 | ||
| Conservative | Margaret Middleton | 595 | 20 | ||
| Green | Will White | 228 | 7 | ||
| Majority | 977 | ||||
| Registered electors | 10,568 | ||||
| Turnout | 3,044 | 29 | |||
| Rejected ballots | 10 | ||||
| Labour hold | Swing | ||||
Linacre
| Party | Candidate | Votes | % | ±% | |
|---|---|---|---|---|---|
| Labour | John Fairclough* | 1,166 | 76 | ||
| Green | Lily Davies | 139 | 9 | ||
| Independent | John Rice | 138 | 9 | ||
| Conservative | Anne Clegg | 91 | 6 | ||
| Majority | 1,027 | ||||
| Registered electors | 8,932 | ||||
| Turnout | 1,532 | 17 | |||
| Rejected ballots | 8 | ||||
| Labour hold | Swing | ||||
Litherland
| Party | Candidate | Votes | % | ±% | |
|---|---|---|---|---|---|
| Labour | Paul Tweed* | 1,556 | 75 | ||
| Independent | Ian Smith | 262 | 13 | ||
| Green | Graham Bentley | 155 | 7 | ||
| Conservative | Michael Crichton | 110 | 5 | ||
| Majority | 1,294 | ||||
| Registered electors | 8,908 | ||||
| Turnout | 2,083 | 23 | |||
| Rejected ballots | 8 | ||||
| Labour hold | Swing | ||||
Manor
| Party | Candidate | Votes | % | ±% | |
|---|---|---|---|---|---|
| Labour | Clare-Louise Carragher* | 1,874 | 60 | ||
| Conservative | Jan Blanchard | 559 | 18 | ||
| Liberal Democrats | John Gibson | 335 | 11 | ||
| Green | James O'Keefe | 280 | 9 | ||
| Freedom Alliance | Marie Harrison | 84 | 3 | ||
| Majority | 1,315 | ||||
| Registered electors | 9,792 | ||||
| Turnout | 3,132 | 32 | |||
| Rejected ballots | 8 | ||||
| Labour hold | Swing | ||||
Meols
| Party | Candidate | Votes | % | ±% | |
|---|---|---|---|---|---|
| Liberal Democrats | Lauren Davidson | 1,502 | 44.7 | -10.0 | |
| Conservative | Bob Teesdale | 879 | 26.2 | +9.1 | |
| Labour | Stephen Jowett | 791 | 23.5 | +8.5 | |
| Green | Pauline Hesketh | 189 | 5.6 | +1.8 | |
| Majority | 523 | ||||
| Registered electors | 9,899 | ||||
| Turnout | 3,361 | 34 | |||
| Rejected ballots | 14 | ||||
| Liberal Democrats hold | Swing | ||||
Molyneux
| Party | Candidate | Votes | % | ±% | |
|---|---|---|---|---|---|
| Labour | Marion Atkinson* | 2,126 | 74 | ||
| Maghull Community Independents | Joanne McCall | 400 | 14 | ||
| Conservative | Morgan Walton | 235 | 8 | ||
| Freedom Alliance | Carolyn Fitzgerald | 124 | 4 | ||
| Majority | 1,726 | ||||
| Registered electors | 10,172 | ||||
| Turnout | 2,885 | 28 | |||
| Rejected ballots | 24 | ||||
| Labour hold | Swing | ||||
Netherton and Orrell
| Party | Candidate | Votes | % | ±% | |
|---|---|---|---|---|---|
| Labour | Sue Bradshaw* | 1,767 | 85 | ||
| Conservative | Stephen Witham | 186 | 9 | ||
| Freedom Alliance | Maria Walsh | 133 | 6 | ||
| Majority | 1,581 | ||||
| Registered electors | 9,577 | ||||
| Turnout | 2,086 | 22 | |||
| Rejected ballots | 12 | ||||
| Labour hold | Swing | ||||
Norwood
| Party | Candidate | Votes | % | ±% | |
|---|---|---|---|---|---|
| Labour | Greg Myers* | 1,754 | 59 | ||
| Liberal Democrats | Jo Barton | 552 | 19 | ||
| Conservative | Pam Teesdale | 465 | 16 | ||
| Green | David Mcintosh | 188 | 6 | ||
| Majority | 1,203 | ||||
| Registered electors | 10,217 | ||||
| Turnout | 2,958 | 29 | |||
| Rejected ballots | 15 | ||||
| Labour hold | Swing | ||||
Park
| Party | Candidate | Votes | % | ±% | |
|---|---|---|---|---|---|
| Labour Co-op | Mike Desmond | 1,436 | 44 | ||
| Maghull Community Independents | John Sayers* | 1,320 | 41 | ||
| Conservative | Greg Titherington | 264 | 8 | ||
| Green | Roy Greason | 125 | 4 | ||
| Liberal Democrats | Keith Cawdron | 86 | 3 | ||
| Majority | 116 | ||||
| Registered electors | 9,643 | ||||
| Turnout | 3,231 | 33.5 | |||
| Rejected ballots | 17 | ||||
| Labour gain from Maghull Community Independents | Swing | ||||
Ravenmeols
| Party | Candidate | Votes | % | ±% | |
|---|---|---|---|---|---|
| Labour | Chris Page | 1,623 | 47.5 | ||
| Independent | Maria Bennett* | 1,072 | 31.4 | ||
| Conservative | Angelica Sadrieva | 334 | 9.8 | ||
| Green | Alison Gibbon | 199 | 5.8 | ||
| Liberal Democrats | Lisa Nicolson-Smith | 186 | 5.4 | ||
| Majority | 551 | 16.1 | |||
| Turnout | 3,414 | ||||
| Registered electors | 9,638 | ||||
| Rejected ballots | 13 | ||||
| Labour gain from Independent | Swing | ||||
St Oswald
| Party | Candidate | Votes | % | ±% | |
|---|---|---|---|---|---|
| Labour | Paula Spencer* | 1,362 | 82.1 | ||
| Conservative | Karl Starkey | 151 | 9.1 | ||
| TUSC | Conor O'Neill | 145 | 8.7 | ||
| Majority | 1,211 | 73.0 | |||
| Turnout | 1,658 | ||||
| Registered electors | 8,072 | ||||
| Rejected ballots | 8 | ||||
| Labour hold | Swing | ||||
Sudell
| Party | Candidate | Votes | % | ±% | |
|---|---|---|---|---|---|
| Labour Co-op | Phil Hart | 1,761 | 52.8 | ||
| Maghull Community Independents | Patrick McKinley* | 1,208 | 36.2 | ||
| Conservative | Daniel Kirk | 304 | 9.1 | ||
| Freedom Alliance | Marie Blease | 61 | 1.8 | ||
| Majority | 553 | 16.6 | |||
| Turnout | 3,334 | ||||
| Registered electors | 10,348 | ||||
| Rejected ballots | 13 | ||||
| Labour hold | Swing | ||||
Victoria
| Party | Candidate | Votes | % | ±% | |
|---|---|---|---|---|---|
| Labour | Leslie Byrom* | 2,348 | 61.4 | +12.9 | |
| Liberal Democrats | Hannah Gee | 772 | 20.2 | -8.8 | |
| Green | Samantha Cook | 379 | 9.9 | -2.5 | |
| Conservative | Andrew Burgess | 328 | 8.6 | -1.6 | |
| Majority | 1,576 | 41.2 | |||
| Turnout | 3,827 | ||||
| Registered electors | 10,498 | ||||
| Rejected ballots | 13 | ||||
| Labour hold | Swing | ||||
References
- ↑ Of the four councillors prior to the election who did not belong to a registered political party, two formed the "Southport Councillors Group" led by Sinclair D'Albuquerque, and two formed the "Independent Group" led by David Irving.
- ↑ "Sefton Borough Elections 2023". Sefton Metropolitan Borough Council. Retrieved 20 April 2023.
- ↑ Raynor, Dominic (5 May 2023). "Sefton local election results 2023". Liverpool World. Retrieved 20 May 2023.
- ↑ "Local elections 2023: Labour retains control in Liverpool, Knowsley, Halton and Sefton". BBC News. 5 May 2023. Retrieved 20 May 2023.
- ↑ "Election results for Ainsdale, 4 May 2023". 4 May 2023.
- ↑ "Sefton Local Elections 2023: Results as they happen live". 4 May 2023.
- ↑ "Election results for Birkdale, 5 May 2022". 5 May 2022.
This article is issued from Wikipedia. The text is licensed under Creative Commons - Attribution - Sharealike. Additional terms may apply for the media files.