| |||||||||||||||||||||||||||||||||||||||||||||||||
22 of 66 seats (One Third) to Wirral Metropolitan Borough Council 34 seats needed for a majority | |||||||||||||||||||||||||||||||||||||||||||||||||
|---|---|---|---|---|---|---|---|---|---|---|---|---|---|---|---|---|---|---|---|---|---|---|---|---|---|---|---|---|---|---|---|---|---|---|---|---|---|---|---|---|---|---|---|---|---|---|---|---|---|
| Turnout | 36.1% ( | ||||||||||||||||||||||||||||||||||||||||||||||||
| |||||||||||||||||||||||||||||||||||||||||||||||||
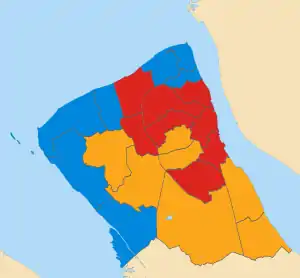 Map of results of 2007 election | |||||||||||||||||||||||||||||||||||||||||||||||||
| |||||||||||||||||||||||||||||||||||||||||||||||||
The 2007 Wirral Metropolitan Borough Council election took place on 3 May 2007 to elect members of Wirral Metropolitan Borough Council in England.[1] This election was held on the same day as other local elections.
After the election, the composition of the council was:
| Party | Seats | ± | |
|---|---|---|---|
| Labour | 25 | ||
| Conservative | 21 | ||
| Liberal Democrat | 20 | ||
Election results
Overall election result
Overall result compared with 2006.
| Wirral Metropolitan Borough Council election result, 2007 | |||||||||||||||
|---|---|---|---|---|---|---|---|---|---|---|---|---|---|---|---|
| Party | Candidates | Votes | |||||||||||||
| Stood | Elected | Gained | Unseated | Net | % of total | % | No. | Net % | |||||||
| Conservative | 22 | 7 | 1 | 1 | 31.8 | 38.6 | 34,081 | ||||||||
| Labour | 22 | 8 | 0 | 1 | 36.4 | 28.7 | 25,399 | ||||||||
| Liberal Democrats | 22 | 7 | 1 | 0 | 31.8 | 25.2 | 22,289 | ||||||||
| Green | 22 | 0 | 0 | 0 | 0.0 | 5.4 | 4,809 | ||||||||
| UKIP | 6 | 0 | 0 | 0 | 0.0 | 1.7 | 1,475 | ||||||||
| Independent | 1 | 0 | 0 | 0 | 0.0 | 0.4 | 311 | N/A | |||||||
Ward results
Results compared directly with the last local election in 2006.
Bebington
| Party | Candidate | Votes | % | ±% | |
|---|---|---|---|---|---|
| Labour | Jerry Williams | 2,201 | 43.7 | ||
| Conservative | Les Thomas | 1,554 | 30.9 | ||
| Liberal Democrats | Christopher Jackson | 580 | 11.5 | ||
| UKIP | Hilary Jones | 514 | 10.2 | ||
| Green | Michael Harper | 187 | 3.7 | ||
| Majority | 647 | 12.8 | |||
| Registered electors | 12,020 | ||||
| Turnout | 41.9 | ||||
| Labour hold | Swing | ||||
Bidston and St James
| Party | Candidate | Votes | % | ±% | |
|---|---|---|---|---|---|
| Labour | Harry Smith | 1,384 | 59.7 | ||
| Independent | George Thomas | 311 | 13.4 | New | |
| Conservative | Fiona Marsh | 292 | 12.6 | ||
| Liberal Democrats | John Brace | 215 | 9.3 | ||
| Green | George Bowler | 116 | 5.0 | ||
| Majority | 1,073 | 46.3 | |||
| Registered electors | 10,380 | ||||
| Turnout | 22.4 | ||||
| Labour hold | Swing | ||||
Birkenhead and Tranmere
| Party | Candidate | Votes | % | ±% | |
|---|---|---|---|---|---|
| Labour | Phillip Davies | 1,399 | 62.4 | ||
| Liberal Democrats | Alan Brighouse | 333 | 14.9 | ||
| Conservative | June Cowin | 255 | 11.4 | ||
| Green | Catherine Page | 254 | 11.3 | ||
| Majority | 1,066 | 47.5 | |||
| Registered electors | 10,374 | ||||
| Turnout | 21.7 | ||||
| Labour hold | Swing | ||||
Bromborough
| Party | Candidate | Votes | % | ±% | |
|---|---|---|---|---|---|
| Liberal Democrats | Robert Moon | 1,753 | 48.3 | ||
| Labour | Audrey Moore | 1,002 | 27.6 | ||
| Conservative | Mark Gibson | 684 | 18.8 | ||
| Green | Joyce Hogg | 192 | 5.3 | ||
| Majority | 751 | 20.7 | |||
| Registered electors | 10,953 | ||||
| Turnout | 33.3 | ||||
| Liberal Democrats hold | Swing | ||||
Clatterbridge
| Party | Candidate | Votes | % | ±% | |
|---|---|---|---|---|---|
| Liberal Democrats | Alan Jennings | 2,401 | 44.7 | ||
| Conservative | Cherry Povall | 2,152 | 40.1 | ||
| Labour | Ethel Morgan | 643 | 12.0 | ||
| Green | Jim McGinley | 173 | 3.2 | ||
| Majority | 249 | 4.6 | |||
| Registered electors | 11,856 | ||||
| Turnout | 45.4 | ||||
| Liberal Democrats hold | Swing | ||||
Claughton
| Party | Candidate | Votes | % | ±% | |
|---|---|---|---|---|---|
| Labour | Stephen Foulkes | 1,784 | 52.0 | ||
| Conservative | Barbara Sinclair | 943 | 27.5 | ||
| Liberal Democrats | Anna Blumenthal | 485 | 14.1 | ||
| Green | Garnette Bowler | 218 | 6.4 | ||
| Majority | 841 | 24.5 | |||
| Registered electors | 11,553 | ||||
| Turnout | 29.8 | ||||
| Labour hold | Swing | ||||
Eastham
| Party | Candidate | Votes | % | ±% | |
|---|---|---|---|---|---|
| Liberal Democrats | Dave Mitchell | 3,067 | 70.3 | ||
| Conservative | Graham Davies | 661 | 15.2 | ||
| Labour | Christopher Lawler | 518 | 11.9 | ||
| Green | Brian Gibbs | 114 | 2.6 | ||
| Majority | 2,406 | 55.1 | |||
| Registered electors | 11,164 | ||||
| Turnout | 39.1 | ||||
| Liberal Democrats hold | Swing | ||||
Greasby, Frankby and Irby
| Party | Candidate | Votes | % | ±% | |
|---|---|---|---|---|---|
| Liberal Democrats | Peter Reisdorf | 2,552 | 47.3 | ||
| Conservative | Vida Wilson | 1,846 | 34.2 | ||
| Labour | Barbara Moores | 553 | 10.3 | ||
| UKIP | Mike Pepler | 309 | 5.7 | New | |
| Green | Perle Sheldricks | 132 | 2.4 | ||
| Majority | 706 | 13.1 | |||
| Registered electors | 11,607 | ||||
| Turnout | 46.2 | ||||
| Liberal Democrats hold | Swing | ||||
Heswall
| Party | Candidate | Votes | % | ±% | |
|---|---|---|---|---|---|
| Conservative | Andrew Hodson | 3,385 | 69.3 | ||
| Liberal Democrats | David Evans | 618 | 12.7 | ||
| Labour | Philip Waterfield | 589 | 12.1 | ||
| Green | Anne Rosseinsky | 292 | 6.0 | ||
| Majority | 2,767 | 56.6 | |||
| Registered electors | 11,136 | ||||
| Turnout | 44.0 | ||||
| Conservative hold | Swing | ||||
Hoylake and Meols
| Party | Candidate | Votes | % | ±% | |
|---|---|---|---|---|---|
| Conservative | Gerry Ellis | 2,944 | 66.7 | ||
| Labour | Alan Milne | 665 | 15.1 | ||
| Liberal Democrats | Alexander Clark | 457 | 10.3 | ||
| Green | Hara Willow | 350 | 7.9 | ||
| Majority | 2,279 | 51.6 | |||
| Registered electors | 10,606 | ||||
| Turnout | 41.7 | ||||
| Conservative hold | Swing | ||||
Leasowe and Moreton East
| Party | Candidate | Votes | % | ±% | |
|---|---|---|---|---|---|
| Labour | Ron Abbey | 1,682 | 44.3 | ||
| Conservative | Ian Lewis | 1,664 | 43.9 | ||
| Liberal Democrats | Gerald Hainsworth | 244 | 6.4 | ||
| Green | Rosemary Bland | 204 | 5.4 | ||
| Majority | 18 | 0.4 | |||
| Registered electors | 11,087 | ||||
| Turnout | 34.3 | ||||
| Labour hold | Swing | ||||
Liscard
| Party | Candidate | Votes | % | ±% | |
|---|---|---|---|---|---|
| Conservative | Karen Hayes | 2,116 | 49.7 | ||
| Labour | Gary Leech | 1,609 | 37.8 | ||
| Liberal Democrats | Daniel Clein | 244 | 5.7 | ||
| UKIP | Phil Griffiths | 149 | 3.5 | ||
| Green | Rebecca Koncienzcy | 143 | 3.4 | ||
| Majority | 507 | 11.9 | |||
| Registered electors | 11,418 | ||||
| Turnout | 37.4 | ||||
| Conservative gain from Labour | Swing | ||||
Moreton West and Saughall Massie
| Party | Candidate | Votes | % | ±% | |
|---|---|---|---|---|---|
| Conservative | Suzanne Moseley | 2,365 | 60.5 | ||
| Labour | Darren Dodd | 943 | 24.1 | ||
| Liberal Democrats | Eric Copestake | 306 | 7.8 | ||
| Green | James Drew | 160 | 4.1 | ||
| UKIP | Natasha Minns | 136 | 3.5 | New | |
| Majority | 1,422 | 36.4 | |||
| Registered electors | 11,087 | ||||
| Turnout | 35.3 | ||||
| Conservative hold | Swing | ||||
New Brighton
| Party | Candidate | Votes | % | ±% | |
|---|---|---|---|---|---|
| Conservative | Tony Pritchard | 1,814 | 45.7 | ||
| Labour | Anne McArdle | 1,256 | 31.6 | ||
| Green | Cynthia Stonall | 534 | 13.4 | ||
| Liberal Democrats | Nicol Hick | 368 | 9.3 | ||
| Majority | 558 | 14.1 | |||
| Registered electors | 11,095 | ||||
| Turnout | 35.7 | ||||
| Conservative hold | Swing | ||||
Oxton
| Party | Candidate | Votes | % | ±% | |
|---|---|---|---|---|---|
| Liberal Democrats | Stuart Kelly | 2,007 | 54.8 | ||
| Labour | David Barden | 693 | 18.9 | ||
| Conservative | Marcus Bleasdale | 611 | 16.7 | ||
| Green | Marilyn Jones | 193 | 5.3 | ||
| UKIP | Cathy Williams | 158 | 4.3 | ||
| Majority | 1,314 | 35.9 | |||
| Registered electors | 11,278 | ||||
| Turnout | 32.6 | ||||
| Liberal Democrats hold | Swing | ||||
Pensby and Thingwall
| Party | Candidate | Votes | % | ±% | |
|---|---|---|---|---|---|
| Liberal Democrats | Sarah Quinn | 2,110 | 44.0 | ||
| Conservative | Jacquie McKelvie | 1,777 | 37.0 | ||
| Labour | John Cunningham | 742 | 15.5 | ||
| Green | Allen Burton | 170 | 3.5 | ||
| Majority | 333 | 7.0 | |||
| Registered electors | 10,743 | ||||
| Turnout | 44.8 | ||||
| Liberal Democrats gain from Conservative | Swing | ||||
Prenton
| Party | Candidate | Votes | % | ±% | |
|---|---|---|---|---|---|
| Liberal Democrats | Simon Holbrook | 2,148 | 52.3 | ||
| Labour | Denise Realey | 1,105 | 26.9 | ||
| Conservative | Andrew Burns | 677 | 16.5 | ||
| Green | Mark Mitchell | 177 | 4.3 | ||
| Majority | 1,043 | 25.4 | |||
| Registered electors | 11,141 | ||||
| Turnout | 36.9 | ||||
| Liberal Democrats hold | Swing | ||||
Rock Ferry
| Party | Candidate | Votes | % | ±% | |
|---|---|---|---|---|---|
| Labour | Chris Meaden | 1,474 | 59.6 | ||
| Conservative | Joanne Suffield | 433 | 17.5 | ||
| Liberal Democrats | Peter Heppinstall | 342 | 13.8 | ||
| Green | Peter Exley | 224 | 9.1 | ||
| Majority | 1,041 | 42.1 | |||
| Registered electors | 10,292 | ||||
| Turnout | 24.1 | ||||
| Labour hold | Swing | ||||
Seacombe
| Party | Candidate | Votes | % | ±% | |
|---|---|---|---|---|---|
| Labour | Denis Knowles | 1,447 | 59.5 | ||
| Conservative | Bernie Howden | 527 | 21.7 | ||
| Liberal Democrats | Steve Pitt | 299 | 12.3 | ||
| Green | Beverley Kells | 160 | 6.6 | ||
| Majority | 920 | 37.8 | |||
| Registered electors | 10,614 | ||||
| Turnout | 23.0 | ||||
| Labour hold | Swing | ||||
Upton
| Party | Candidate | Votes | % | ±% | |
|---|---|---|---|---|---|
| Labour | Tony Smith | 1,931 | 43.1 | ||
| Conservative | Julie Kirwan | 1,734 | 38.7 | ||
| Liberal Democrats | Christopher Beazer | 575 | 12.8 | ||
| Green | Marian Hussenbux | 244 | 5.4 | ||
| Majority | 197 | 4.4 | |||
| Registered electors | 12,311 | ||||
| Turnout | 36.4 | ||||
| Labour hold | Swing | ||||
Wallasey
| Party | Candidate | Votes | % | ±% | |
|---|---|---|---|---|---|
| Conservative | Paul Hayes | 2,801 | 58.3 | ||
| Labour | Christine Jones | 1,138 | 23.7 | ||
| Liberal Democrats | John Uriel | 466 | 9.7 | ||
| UKIP | Ian Watson | 209 | 4.4 | New | |
| Green | Percy Hogg | 189 | 3.9 | ||
| Majority | 1,663 | 34.6 | |||
| Registered electors | 11,979 | ||||
| Turnout | 40.1 | ||||
| Conservative hold | Swing | ||||
West Kirby and Thurstaston
| Party | Candidate | Votes | % | ±% | |
|---|---|---|---|---|---|
| Conservative | David Elderton | 2,846 | 62.0 | ||
| Liberal Democrats | John Cresswell | 719 | 15.7 | ||
| Labour | James Brown | 641 | 14.0 | ||
| Green | Patrick Cleary | 383 | 8.3 | ||
| Majority | 2,127 | 46.3 | |||
| Registered electors | 10,493 | ||||
| Turnout | 43.9 | ||||
| Conservative hold | Swing | ||||
Changes between 2007 and 2008
| Date | Ward | Name | Previous affiliation | New affiliation | Circumstance | ||
|---|---|---|---|---|---|---|---|
| May 2007 | Clatterbridge | Isabel Moon | Liberal Democrats | Ind. Liberal Democrat | Resigned.[53] | ||
| June 2007 | Hoylake and Meols | David Kirwan | Conservative | Ind. Conservative | Resigned.[54] | ||
Notes
• italics denote the sitting councillor • bold denotes the winning candidate
References
- 1 2 3 "Local election - 03 May 2007 Summary". Wirral Metropolitan Borough Council.
- ↑ "Local Election Results 2007 Wirral". Local Elections Archive Project.
- 1 2 3 4 5 6 7 8 9 10 11 12 13 14 15 16 17 18 19 20 21 22 "03 May 2007 - Election Results". Wirral Metropolitan Borough Council.
- ↑ "Bebington Ward — Wirral". Local Elections Archive Project.
- ↑ "Councillor Jerry Williams". Wirral Metropolitan Borough Council.
- ↑ "Bidston and St James Ward — Wirral". Local Elections Archive Project.
- ↑ "Councillor Harry Smith". Wirral Metropolitan Borough Council.
- ↑ "Birkenhead and Tranmere Ward — Wirral". Local Elections Archive Project.
- ↑ "Councillor Phil Davies". Wirral Metropolitan Borough Council. Archived from the original on 12 June 2018. Retrieved 12 June 2018.
- ↑ "Councillor Alan Brighouse". Wirral Metropolitan Borough Council. Archived from the original on 12 June 2018. Retrieved 12 June 2018.
- ↑ "Bromborough Ward — Wirral". Local Elections Archive Project.
- ↑ "Councillor Bob Moon". Wirral Metropolitan Borough Council.
- ↑ "Clatterbridge Ward — Wirral". Local Elections Archive Project.
- ↑ "Councillor Alan Jennings". Wirral Metropolitan Borough Council.
- ↑ "Councillor Cherry Povall, JP". Wirral Metropolitan Borough Council.
- ↑ "Claughton Ward — Wirral". Local Elections Archive Project.
- ↑ "Councillor Steve Foulkes". Wirral Metropolitan Borough Council.
- ↑ "Eastham Ward — Wirral". Local Elections Archive Project.
- ↑ "Councillor Dave Mitchell". Wirral Metropolitan Borough Council. Archived from the original on 12 June 2018. Retrieved 12 June 2018.
- ↑ "Greasby, Frankby and Irby Ward — Wirral". Local Elections Archive Project.
- ↑ "Councillor Peter Reisdorf". Wirral Metropolitan Borough Council. Archived from the original on 12 June 2018. Retrieved 12 June 2018.
- ↑ "Heswall Ward — Wirral". Local Elections Archive Project.
- ↑ "Councillor Andrew Hodson". Wirral Metropolitan Borough Council.
- ↑ "Hoylake and Meols Ward — Wirral". Local Elections Archive Project.
- ↑ "Councillor Gerry Ellis". Wirral Metropolitan Borough Council.
- ↑ "Leasowe and Moreton East Ward — Wirral". Local Elections Archive Project.
- ↑ "Councillor Ron Abbey". Wirral Metropolitan Borough Council.
- ↑ "Councillor Ian Lewis". Wirral Metropolitan Borough Council.
- ↑ "Liscard Ward — Wirral". Local Elections Archive Project.
- ↑ "Councillor Karen Hayes". Wirral Metropolitan Borough Council.
- ↑ "Moreton West and Saughall Massie Ward — Wirral". Local Elections Archive Project.
- ↑ "Councillor Darren Dodd". Wirral Metropolitan Borough Council.
- ↑ "New Brighton Ward — Wirral". Local Elections Archive Project.
- ↑ "Councillor Tony Pritchard". Wirral Metropolitan Borough Council.
- ↑ "Councillor Anne McArdle". Wirral Metropolitan Borough Council.
- ↑ "Oxton Ward — Wirral". Local Elections Archive Project.
- ↑ "Councillor Stuart Kelly". Wirral Metropolitan Borough Council.
- ↑ "Pensby and Thingwall Ward — Wirral". Local Elections Archive Project.
- ↑ "Prenton Ward — Wirral". Local Elections Archive Project.
- ↑ "Councillor Simon Holbrook". Wirral Metropolitan Borough Council. Archived from the original on 12 June 2018. Retrieved 12 June 2018.
- ↑ "Councillor Denise Realey". Wirral Metropolitan Borough Council.
- ↑ "Rock Ferry Ward — Wirral". Local Elections Archive Project.
- ↑ "Councillor Chris Meaden". Wirral Metropolitan Borough Council.
- ↑ "Seacombe Ward — Wirral". Local Elections Archive Project.
- ↑ "Councillor Denis Knowles". Wirral Metropolitan Borough Council.
- ↑ "Upton Ward — Wirral". Local Elections Archive Project.
- ↑ "Councillor Tony Smith". Wirral Metropolitan Borough Council.
- ↑ "Wallasey Ward — Wirral". Local Elections Archive Project.
- ↑ "Councillor Paul Hayes". Wirral Metropolitan Borough Council.
- ↑ "West Kirby and Thurstaston Ward — Wirral". Local Elections Archive Project.
- ↑ "Councillor David M Elderton". Wirral Metropolitan Borough Council.
- ↑ "Councillor Pat Cleary". Wirral Metropolitan Borough Council.
- ↑ Copestake, Eric (19 June 2007). "Councillors also have a 'third duty'". Wirral Globe. Retrieved 28 December 2018.
- ↑ Dunn, Justin (4 July 2007). "Another one bites the dust". Wirral Globe. Retrieved 28 December 2018.
This article is issued from Wikipedia. The text is licensed under Creative Commons - Attribution - Sharealike. Additional terms may apply for the media files.